Saturday, January 30, 2010

MACROECONOMIC EQUILIBRIUM: Putting it all Together

So, we have the aggregate supply curve and we have the aggregate demand curve.
AD measures levels of production which won't change over time as a function of price
AS measures levels of production which suppliers will actually produce at as a function of price.
SO... what happens when you put both of them together?

Answer: You get a real level of output which doesn't change over time (at the intersection point). Here, GDP is at an equilibrium, which means that output is equal to expenditures. Also GDP is an actual achievable level of output, which firms are willing to produce at, given the price level, to maximize profits: The actual output is in equilibrium!

The general price level is the y-axis, and we can use it to determine inflation (increases in the general price level)
GDP is the x-axis, and we can use actual GDP in relation to potential GDP to determine unemployment

This is also a stable equilibrium! If the price level is too low, then aggregate demand will overwhelm what producers are actually willing to produce. As production increases to meet the needs of the consumers, however, the accompanying rise in the price level reduces consumer demand until the two meet in the middle. Whenever the economy is not at macroeconomic equilibrium, there are pressures which ultimately bring it back to a state of equilibrium

Aggregate Demand Shocks and Macroeconomic Equilibrium:

These are a bit more tricky. If a change in autonomous expenditure shifts the family of aggregate expenditure functions, then in turn the Aggregate Demand function will shift (to the left in expenditure is lower, and to the right if it is higher). However, in macroeconomic equilibrium, an increase in aggregate demand predicts an accompanying increase in prices, while lower aggregate demand predicts an accompanying drop in prices (remember, firms will only produce more if prices increase to stabilize profit margins). This change in the price level changes aggregate expenditure, causing it to shift up or down due to a new price!

As a general rule, both price and output move in the same direction as a demand shock (increased demand = more output at higher prices. Decreased = less output at lower prices)

You may have noticed, but the simple multiplier, due to the change in price, can no longer predict the change in output caused by changes in expenditure. Instead, we use the multiplier (not simple, just multiplier) to determine output changes which result from expenditure changes. The multiplier is smaller than the simple multiplier. It represents the change in GDP divided by the change in aggregate expenditure.

The severity of a demand shock depends on the state of the economy: in other words, where an economy lies on the Aggregate Supply Curve.

When the economy has excess capacity (constant costs of production), it is called Keynesian short run aggregate supply (this is the flat part of the AS curve). Increases in AE cause Y to rise and Price to remain the same.

When the economy has increasing costs (the middle of this graph where the AS curve is about diagonally sloped), this is intermediate short run aggregate supply. Here, increases in aggregate expenditure cause increases in both price and output.

When the economy has rapidly increasing costs, this is classical short run supply (the vertical part of the AS curve). Here, increases in aggregate expenditure lead to increases in price, and no change in output.

Basically, the steeper AS is, the more a demand shock will affect price, and the less it will affect output.

We can have supply shocks too! The new intersection point is the new stable macroeconomic equilibrium.


Be careful- in some cases, both AS and AD will shift in response to a single event! (for an example, let's say the price level in China rises. This increases domestic AD (because of increased net exports). However, if domestic producers buy a lot of intermediate products from China, then their costs of production just rose, so aggregate supply shifts to the left. The net effect could be either positive or negative: it depends how invest producers are in chinese intermediate goods, and how much of the domestic economy is trade-determined.

Okay- that's all you'll need for the test. Good luck!

Aggregate Supply

In the short run, we're going to assume that factor prices remain constant (but later on, this can change, as we look at the long run)

The short run aggregate supply curve shows the amount which firms are willing to produce at any given price level.

Aggregate Supply is positively sloped!

Why?

Well, as firms increase output and input prices are constant, the law of diminishing marginal returns causes marginal output per factor to fall, and the short run average cost to rise. THUS, in order to retain expected profit margins, the only way for producers to feasibly increase production is to increase the price of goods: as such, as price rises, the actual GDP/output which firms will produce increases- there is a positive relationship here.

What about the slope? Why is it increasing?

Well... at low levels of output, firms have excess capacity, so they are capable of increasing output without making a huge investment, and the law of diminishing marginal returns hasn't really kicked in yet. Production can be increased at a relatively low cost (this corresponds to the flatter part of the curve)

At higher levels of output, however, there is no excess capacity, and great costs must be incurred to increase production.

Aggregate supply can shift (we call this an aggregate supply shock!). Basically, anything which would cause the cost of inputs (wages, intermediate goods, machinery, etc.) to rise OR anything which lowers the productivity of those factor inputs (like a rainy day on a farm) will shift the aggregate supply curve to the left (and consequently, lower input costs shifts AS to the right)

Friday, January 15, 2010

Adding Investment to the Consumption Function, and then Finding Equilibrium

Before we move on to investment, it's important to understand the difference between shifts in consumption and movement along the consumption function.

Movement along the consumption function occurs whenever the national income changes- if it increases, then we move up and to the right along the consumption function. If the national income decreases, we move left and downwards along the consumption function. The graph itself, however, doesn't move in response to changes in national income.

Changes in the ceteris paribus variables (wealth, expectations, and interest rates), however CAN shift the consumption function up and down. This constitutes a SHIFT in consumption!

When consumption increases, the graph shifts up. When consumption decreases, the graft shifts down.

WEALTH causes direct shifts: an increase in wealth causes an upward shift of consumption
EXPECTATIONS cause direct shifts: optimism causes upward consumption shifts, while pessimism causes downward consumption shifts
INTEREST RATES cause inverse shifts: as interest rates rise, consumption decreases and vice versa.

Most of these variables tend to remain stable in the short run, however, so economists suspect that changes in consumption are not the root cause of the fluctuations we witness in business cycles.


There are other theories about consumption other than the one we have just learned about!
Modigliani and Friedman both came up with similar theories that suggest that consumption is a function of someone's average lifelong income, rather than current disposable income. This accounts for consumption which continues to remain high after retirement- current disposable income is very low for retirees, but they are able to live off of some stockpiled income from their income throughout the rest of their lives.


Okay.. time to factor in INVESTMENT!

Remember, investment involves Plant and Equipment, Inventories, and Residential Construction. Of all of these subfactors of investment, inventories tend to fluctuate the most.

There at 3 BIG factors which affect investment, so you could think of all of these at the ceteris paribus variables for investment
-The Real Interest Rate
-Changes in Sales
-Business Confidence

(Technology improvements, a decline in the price of new capital goods, and higher relative output prices may also affect investment, but we don't have to worry about that right now)

Interest Rates have a reverse relation to investment: the higher the interest rates, the higher the opportunity cost of borrowing money for investment, so overall investment decreases as interest rates rise

Sales have a direct relationship with investment. As sales increase, businesses need to have a larger inventory to buffer possible stock depletion, and also sales requires greater production, which facilitates investment in more plant an equipment.

Business Confidence has a direct relationship with investment. If business are confident that their economic futures are promising, then they will invest in more plants, equipment, buildings, and inventories. If the prospects appear grim, however, and businesses are uncertain if they will make profits in the near future, they are far less likely to invest.

SOOO: Investment is related and affected by these three factors... BUUUUUUUUUTTTTTTTTTTTTT
INVESTMENT IS NOT RELATED TO NATIONAL INCOME! IT IS AUTONOMOUS

In other words, if we were to graph investment as a function of national income, it would be a constant, flat-line graph!

Investment stays the same even as national income change, as long as the ceteris paribus variables remain constant.
Changes in the ceteris paribus variables can shift investment up or down, however!

OKAY: That's all we need to know about investment. Now, we just have to put the two together: This is called aggregate expenditure, and we graph it as a function of national income, so AE = f(Y)
In a frugal economy (with only a bank added to the economic flow system), desired Aggregate Expenditure = Consumption + Investment
SO, AE = C + I = f(Y)
AE = autonomous consumption + mpc(national income) + Investment
AE = a +b(Y) + I

This is the aggregate expenditure function! The slope of the aggregate expenditure function is called the Marginal Propensity to Spend (The change in expenditure divided by the change in national income)
***Important: You do not want to consume MPSpend with MPS, as MPS is the marginal propensity to save (which is how much money is saved per dollar of income, or the slope of the savings function)

So, now we know what the aggregated expenditure function looks like. Now, the only thing left to do is to figure out where equilibrium is.

SO, where is equilibrium?
It's any point where Income stays constant over time!

Well, there are two ways of thinking about equilibrium in macroeconomics:
-The Garden Hose Theory suggests that equilibrium is when Income is equal to expenditures. If you think about this in terms of the circular flow diagram, this means that the incomes that household receive from firms are equal to the expenditures that firms receive from households. Here, the condition for equilibrium is that the national income must equal expenditures!

-The Bathtub theory suggests that equilibrium is when the amount of monetary injections into an economy are equal to the amount of monetary withdrawal from an economy. Think of it like a bathtub with the tap adding water to the tub, while the drain removes water from the tub. If the tap adds water to the tub at the same rate that the drain removes water from the tub, then the water level in the tub remains the same, so we could say that the tub is in equilibrium! Using our current frugal economic model, equilibrium is when savings (withdrawals) are equal to investment (injections).

You will find that the point where Y = AE and where J (Injections) = W (Withdrawals) is the same!


This is also a stable equilibrium! There are pressures which return both expenditure and investments to equilibrium levels in the event of disequilibrium!

Let's say that desired expenditure is lower than GDP: This means that people want to consume more than an economy is effectively producing. In response to this increase in demand, producers will increase their level of production to make more products to satisfy that demand. That increase in production causes gross domestic product to raise, and eventually align with expenditure!

On the other hand, if GDP is greater than expenditure, this means that more products are being produced by an economy than are being consumed by households. Businesses will notice the drop in sales, and respond by producing fewer products. This reduction in output causes the GDP to fall until it aligns with expenditure.

The savings function works similarly, BECAUSE IT IS DERIVED FROM THE CONSUMPTION FUNCTION!

We can then shift around all of these different graphs by changing ceteris paribus variables, and then try and predict where new equilibriums will be! Expect this sort of thing on your typical, Gateman-style examination! Practice this sort of activity in your precious spare time, and you'll be a macroeconomic whiz-kid!


I bet you're EXCITED!

Wednesday, January 13, 2010

The Importance of Consumption! The consumption function, and other wonderful things!

Quick review:
We have 5 basic macro-economic variables: Y,U,P,i, and e
Y is the bull's eye, which we try to control using fiscal and monetary policy
There are 4 stages to developing our economic model
1) Spendthrift (where there is just the firm and the household)
2) Frugal (which allows for spending and investment through banks)
3) Governed (which factors in taxation and government expenditure)
4) Open (which factors in imports and exports)

Our end-goal is to find the relationship between the general price level and the national income!

Here are some basic assumptions we have to make in building our macroeconomic model right now:
-Demand determines output
-The price level is constant (we pretend there is no inflation)
-In a basic economy, the interest and exchange rates remain constant
-We assume that potential national income is constant

Autonomous versus Induced Variables:
-Autonomous variables do not depend on national income, and thus are external to our model: this includes things like exports, which are determined by foreign economies, not domestic economies

Induced Variables DO depend on national income, and are thus found within our model: imports for an example tend to increase as Canada's national income grows, thus this an induced variable.

Today, we are going to learn about consumption, which is a very important part of national expenditure (the other parts being investment, government expenditure and net exports).

First: DESIRED versus ACTUAL EXPENDITURE:
-This is similar to microeconomics where we talked about willingness to buy (quantity demanded) at a given price. In Macro, we talk about the willingness to expend at a given income- it's a similar concept
-Actual aggregated expenditure is measured by NIEA (national income and expenditure accounts), which is denoted by an "a" subscript
-Desired expenditure is planned or intended expenditure
-It is a combination of consumption, investment, government expenditure, and net exports
-It is a function of national income (so national income effects expenditure)

THE CONSUMPTION FUNCTION: As a general rule, if people have more money, they spend more. Who'd have thunk...
-Consumption is a function of disposable national income! (Yd = current disposable income, which is national income minus taxes). However, in a spendthrift economy, we don't have to worry about taxation! =D

The ceteris paribus variable for the consumption function are
-Wealth (accumulated income: higher wealth generally leads to more consumption)
-Expectations (if prices are expected to rise in the future, this increases current consumption; if prices are expected to fall in the future, this decreases current consumption)
-Interest Rates (higher interest rates decreases consumption)

DESIRED CONSUMPTION IS A FUNCTION OF NATIONAL INCOME! John Meynard Keynes figured this out!

Here are some basic assumptions of the consumption function:
1) There is a break-even level of consumption (where consumption is exactly equal to disposable income)
2) as disposable income increases, consumption increases, but by less and less (in other words, the higher disposable income, the larger the portion of that income which will go into savings)
3) DESIRED CONSUMPTION IS A FUNCTION OF CURRENT DISPOSABLE INCOME!

*On a graph you can see this visually: consumption has risen with national income over the years in Canada.

Okay, so let's see one of these consumption functions!

-First off, this is a simplified version of the consumption function: most real ones would look more like curves, but we don't like to solve quadratics in this class
-The 45 degree line is where consumption is equal to disposable income- any point on this line is the break even point!
-As Y increases, so does C
-Here, Y = Yd (because this is a frugal economy)

-The slope of the consumption like is denoted by the variable 'b', and the actual term for it is the Marginal Propensity to Consume (MPC)
-The Y intercept is autonomous/exogenous expenditure which occurs even when there is no income: this is denoted by the variable 'a'
-Desired Consumption is 'C'
-Any point where consumption is higher than income has dissavings, or borrowed money, while any point where income is higher than consumption has savings

C = a + b(Yd)

for example: Consumption = 100 + 9/10(Disposable Income)

Basically
-Income is either spend (so it goes into consumption) or not spent (so it goes into savings)
-Savings are non-consumption
-Disposable income is then equal to consumption + savings
-Negative savings are dissavings, or loans
-Savings are Disposable income minus consumption
-At the break even point, income is equal to consumption, and savings is equal to zero

It is possible to build a savings function from the consumption function!

The savings function is derived from C = a + b(Yd)
S = Yd - C
if C is a straight linear function, then...
S = -a + (1-b)Yd
S = the vertical distance between C and the break even line (45 degrees)

SOME OTHER TERMS WHICH ARE IMPORTANT TO REMEMBER:
Average Propensity to Consume (APC): This is consumption divided by disposable income- this is the slope of the ray from the origin to the point being considered
Marginal Propensity to Consume (MPC): This is a change in consumption divided by a change in disposable income- this is the slope of the tangent to the curve being considered (so, for this very simplified, linear graph, it is equal to the slope of the consumption function)
Average Propensity to Save (APS): This is savings divided by disposable income- this is the slope of the ray from the origin to the point being considered on the savings function
Marginal Propensity to Save (MPS): This is a change in savings divided by a change in disposable income- this is the slope of the tangent to the curve being considered on the savings function (so for this linear savings curve, it's just equal to the slope of the savings function)

SOME MATHEMATICAL RELATIONSHIPS WHICH WILL MAKE PERFECT SENSE
Income = Consumption + Savings
Income/Income = Consumption/Income + Savings/Income, so 1 = APC + APS
/\Income//\Income = /\Consumption//\Income + /\Savings//\Income, so 1 = MPC + MPS
MPC is a value between 0 and 1
C = a + b(Yd) where a = the vertical intercept and b = MPC

THAT'S ALL FOR TODAY

Monday, January 11, 2010

Calculating National Income

There are three different approaches which we can use to determine the national income. We're going to review all of them in a big, boring, and utterly painful lecture.

1) GDP from Value Added Approach- a measure of the value of all goods and services produced in a fiscal year
2) GDP from Expenditures Side- a measurement of the flow of expenditure
3) GDP from Income Side- a measurement of the flow of income

THE VALUE ADDED APPROACH

Problem: Why not just add the value of each producer's individual output?
Answer: Because production occurs in stages, so in order to avoid counting inputs twice (ie: counting the steel used to build a car, and then the car as well), we must either include only final products in our math, OR only count the value added to products at each stage of production.

Definitions:
Double Counting: Adding the value added more than once to the final value of a good or service
Intermediate Good: output which is used as an input for another good (ie: steel used to build a car)
Final Good: Output NOT used again as an input- output used for final consumption in the time period being considered
Value Added: The value which is added to a product at each stage of production. Revenue minus the cost of intermediate goods from other firms (ie: if a car sells for $2000, and the parts used to make it cost $1000, the added value is $1000). Value added is equal to factor income (WRiP) for any stage of production.
Revenue: Factor Income (WRiP) + The cost of intermediate goods from other firms.

NOTE: Value added does not factor in the costs of factors of production from other firms (so it does not matter how much it costs a steel manufacturer to produce car-steel: this is not factored into the final value of the car)

SO...

GDP (A measure of national income) is the FINAL (not intermediate) MARKET VALUE (determined by the price system of supply and demand) of all GOODS AND SERVICES (goods are tangible, like watermelons. Services are intangible, like haircuts) PRODUCED (so only actual output is measured- flipped assets like stocks or resold real estate does not factor into GDP) in a GIVEN PERIOD (A fiscal year is April to April)

THE EXPENDITURE SIDE APPROACH:

GDP is also equal to the total amount of expenditure required to produce all of the outputs which GDP encompasses.

There are 4 different players in the economy, and thus there are 4 different types of expenditure

CONSUMPTION- Expenditure by the household. This is the 'using up' of a product by a final user. Expenditure can be on durable and non durable goods, as well as services

INVESTMENT- Expenditure by the firm. Investment refers to a change in Capital (Plant, Equipment, Inventory, or Residential Construct). Most of the time, investiture is on goods which are NOT intended for present or immediate consumption. Also, investment is for goods which are used to produce other goods (ie: sewing machines)

Plant and Equipment are "business fixed investment"
Equipment includes machinery and equipment
Inventories are used to buffer fluctuations in production and sales.
Inventories may be outputs or inputs, and they are valued at fair market value
Inventories can be considered investment because they are expenditure on goods not for current consumption, and because we assume that the firm has paid for these goods themselves
Divestment is decumulation, or the reduction of inventory- in other words, a decrease in the stock of fixed goods available to be sold
Residential Construction is investment because a house or building is consumption over a long period of time, and thus not for present consumption
-This only applies to newly built houses or buildings- not purchases from a builder or used homes

GROSS INVESTMENT = NET INVESTMENT + DEPRECIATION! REMEMBER THIS!
Depreciation is the wearing out of capital, and also the cost of replacement capital: it is forced investiture which is not earned by any factor of production

Captial Cost Allowance (CCA) is an income tax act approximation for depreciation

we use GROSS INVESTMENT to calculate GDP (gross investment for gross domestic product- it makes sense). Why? Because all investment, even on broken equipment, creates an income flow and therefore contributes to GDP.

GOVERNMENT EXPENDITURE: This includes all government purchases of goods and services
-These are valued at cost to the government, not at their market value (because it is difficult to assign a market value to certain services which are provided at cost by the government, such as courts)
-Government expenditure also includes government investment!

-TRANSFER PAYMENTS are expenditures not in return for a service. Some examples include expenditure on the Canada Pension Plan, Employment Insurance, and Welfare payments (basically, situations where the government 'gives away' money in some form or another)
-This shows that "expenditure" is not always a "purchase"
-we EXCLUDE transfer payments from our calculation of the government''s expenditures when accounting for GDP

NET EXPORTS:

Exports = X = Goods leaving the country and money entering the country. This adds to our GDP
Imports = M = Goods entering the country and money leaving the country. This lowers our GDP

Net Exports = X - M (it can be positive or negative)

TOTAL EXPENDITURES = GDP

SO...

GDP = Consumption + Investment + Government Expenditure + Net Exports
Y = C+I+G+NetX

Wooooooooooo!
----------------------------
THE INCOME SIDE APPROACH TO GDP
Here, we use income claims from different factors and non-factors of production to calculate the national income. To put it simply we say that the national income is equal to factor payments plus non-factor payments

FACTOR PAYMENTS (WRiP): Another word for these is Net Domestic Product at Factor Costs
"Net" means that we do not take depreciation into account
"Domestic" means that these are domestic factors (ie: we can't add Saudi oil production incomes to Canada's GDP)
"Factor Cost" means the value of output which can be accredited to factors minus the net taxes paid by the firm

DIFFERENT TYPES OF FACTOR PAYMENTS
Wages & Salaries: A return to labour- it can include gross wages, cpp, other pensions, and extra benefits (like dental)
Economic Rent: A return to land- this can include stumpage fees, or oil royalties
Interest: A return to capital- This is the rate of return of capital
Profits: A return to Entrepreneurship and Technology- This includes dividends (distributed profits) and retained earnings (undistributed profits)

NON FACTOR PAYMENTS: Indirect Business Taxes minus Subsidies plus Depreciation
Non factor payments are money which is paid to firms which are not for income claims by factors
In other words, output by firms can generate income NOT accruing to those four factors. These are non-factor payments, and there are 2 types:

1) Indirect Business Taxes less Subsidies: Tax on production collected indirectly by third parties (like excise taxes, provincial sales taxes, and government sales taxes). This is a claim by the government on production which was NOT included in the net domestic product at factor costs. We add this to income to get the MARKET VALUE of goods.
Subsidies are benefits on production contributed indirectly by third parties (like the government subsidizing BC translink)- in other words, these are goods and services whose market value is artificially lowered due to government intervention. As a result, we subtract subsidies from income to get the market value of the good.

To make this easy, let's just say we want to calculate national income using what people ACTUALLY PAY for things: people actually pay indirect business taxes, so we add those, but people don't pay for subsidized portions of things, so we subtract those! Simple enough, right? =D

WriP + (IBT - Subsidies) = Net Domestic Product (NDP)

DEPRECIATION:
-This was not included in the NET domestic product at factor costs
-This is required reinvestment for simply maintaining capital stock
-It is not earned by any factor

NDP + Depreciation = GROSS DOMESTIC PRODUCT! YAY!

SOME EQUATIONS TO REMEMBER:
GDP = Factor Payments (WRiP) + Non Factor Payments ([IBT - Sub] + Dep)
NDP = GDP - Dep
NDPFC = NDP - (IBT - Sub)
WriP = NDPFC
NDPFC + (IBT - Sub) = NDP
NDP + Dep = GDP
---------------------
OTHER THINGS TO WORRY ABOUT

Gross Domestic Product versus Gross National Product

GDP: Income produced in Canada - domestic (it could be made in Canada by non-citizens and still count)
GNP: Income received by Canadians - nationals (it could be made by Canadians working outside of the country)

Calculating Gross National Product:
-GNP = GDP minus factor income produced in Canada but received by foreigners (non-Canadians) plus factor income received by Canadians from abroad

Generally, the value of Canadian based assets owned by foreigners is much greater than the value of foreign assets owned by Canadians (we do have a relatively small population in Canada), so the GDP is much higher than the GNP


Personal Income:
Personal Income is GDP minus any part NOT received by households (Depreciation, retained earnings, etc.)m plus transfer payments received by households: PI = GDP + Net Transfer Payments

Disposable Personal Income: Personal Income minus Personal Income Tax
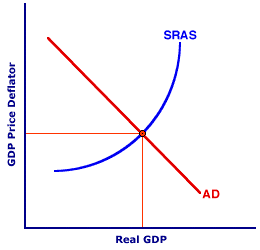


Real Versus Nominal

Nominal values are related to money values, and change according to prices and current values. Nominal values reflect price changes and quantity changes
Real values stay constant over time. Real values only reflect quantity changes

REAL = Nominal/Price Index

For an example, real GDP = Nominal GDP/implicit GDP deflator (an implied raise in the price index, or inflation, in other words)

HOW TO DETERMINE THE IMPLICIT GDP DEFLATOR:
1: Set base year prices
2: Calculate current output at base year prices
3: Compare using ratios

GDP DEFLATOR = Current Q X Current P/Current Q X Base-year P
GDP DEFLATOR = GDP at current prices/GDP at base year prices
GDP DEFLATOR = Nominal GDP/Real GDP


Some things are omitted from GDP, for example...
-Illegal Activities (such as drug sales), because they are difficult to measure or ascertain
-Non-market Activities (such as housework, do it yourself repairs, and volunteer work), because these are not traded as services in a market
-Unreported Activities (such as bartered services or agreements), because they are difficult to measure or ascertain
-Economic "Bads" or negative externalities (such as pollution, stress, congestion, etc.)- these should be deducted from national income, but they are not traded in markets


Definitions for output
Production: Total output (GDP): This describes the size of the economy
Per Capita GDP: GDP divided by population- this is used to measure the standard of living
Productivity: GDP divided by employment, or GDP divided by # of hours worked- this is used to measure the rate of technological change and worker efficiency

Economics, however, is not involved in measuring happiness or quality of life. We leave that to other organizations!

That's all for now....

Friday, January 8, 2010

Basic Macroeconomic Concepts Continued

UNEMPLOYMENT (U):
-News publications will often toss around unemployment rates, but very few people actually know what the unemployment rate means, or what a 'good' rate for employment or unemployment is

Increases in output are either caused by
1) more works being utilized (aka an increase in employment) OR
2) each worker being more productive

In the SHORT RUN, changes in productivity usually don't happen (they take a longer time to come to be realized), so only changes in employment affect output

In the LONG RUN, changes in both productivity and employment can affect output (so the Canadian economy could raise it's GDP either by putting more people to work, or by implementing more efficient production processes [like switching to machine-centric production processes which allow each worker to produce more in a shorter amount of time])

Definitions and Terms Surrounding Employment and Unemployment:
LABOUR FORCE: The total number of people who wish to work at any given time (Unemployment + Employment) ***Note: The size of the labour force can grow and shrink depending on how motivated the general populace is to work. Often, higher wages motivate more people to work, so in times where wages are higher, the labour force is also larger
EMPLOYMENT: The total number of workers ages 15 and older who have any kind of job (including part time work, full time work, and self-employment)
UNEMPLOYMENT: The total number of workers ages 15 and older who are willing and able to work, but have NO job
UNEMPLOYMENT RATE (U): UNEMPLOYMENT/LABOUR FORCE
EMPLOYMENT RATE: EMPLOYMENT/POPULATION

NOTICE how unemployment rate and employment rates are calculated differently? Pretty tricky, huh?

TYPES OF UNEMPOYMENT:
Frictional- turnover unemployment (people who are unemployed because their still trying to find a job that works for them, like recent college graduates)
Structural- unemployment due to mismatching (like when there are 20 positions for teachers and 20 unemployed plumbers- there are enough jobs, but they are the wrong kind of jobs for those who are unemployed)
Cyclical- unemployment that results from recessionary gaps

NAIRU = Non-Accelerating-Inflationary-Rate of -Unemployment: The rate of unemployment that exists at full employment

THE HISTORY OF UNEMPLOYMENT:
-Employment tends to increase fairly constantly in line with growth in the labour force
-Unemployment rates peak during recessions. In Canada, they fluctuate from 12% to 4%, but usually average at around 7%

WHY DOES UNEMPLOYMENT MATTER? Unemployment causes stress and unhappiness on an individual level, and creates economic waste on a macro-level. Overall, it's a very bad sort of thing
---------------------------------
PRODUCTIVITY: Real output per unit of input (all five different kinds of inputs)
LABOUR PRODUCTIVITY: Real output per unit of labour input- this can be measured either per worker or per hour worked

HISTORY OF PRODUCTIVITY IN CANADA:
Real GDP per worker has increased at 1.3% per year
Real GDP per hour has increased at 1.1% per year
Per hour is probably the better measure because the number of hours worked per worker can contribute to per-worker productivity (in other words, we aren't necessarily becoming more productive in Canada as much as we are simply working more hours)

Why does productivity increase? Usually because of increases in human and physical capital.

The trend is that both per hour and per worker GDP have been rising gradually in Canada over time.
------------------------------------
INFLATION (P) OR GENERAL PRICE LEVEL: The average price of all goods in the economy (usually expressed at CPI)
Inflation is defined as an increase in P (an increase in the average cost of all products)

CPI is the consumer price index. This is weighted average of all goods and services in a representative basket of goods (where each good is weighted depending on what percentage of their income the average consumer would spend on it). This is used to measure the cost of living.

Problems with CPI:
-It doesn't adjust for quality changes (ie: situations where you would pay the same amount of money but for a much better product)
-It also doesn't adjust for changes in consumption patterns over time

4 steps to construct an index:
1) Determine the goods in the index
2) Find the base year quantity of goods times the base year price of goods
3) Find the current year quantity of goods times the current price of goods
4) The price index: the ratio of current year/base year

Purchasing power = the number of goods that can be purchased per dollar

HISTORICAL TREND: Inflation has caused the general price level to increase to over 6 times its 1960 level. The rate of inflation can fluctuate wildly

WHY INFLATION MATTERS: Inflation diminishes the purchasing power of money, it reduced the value of fixed assets. If inflation is unanticipated, it can have serious macro effects.
------------------------------
INTEREST RATES (i): The cost of borrowing money
-"The" interest rate is the mean of all of the different interest rates
-The prime rate is the rate which chartered banks charge to preferred customers
-The bank rate is the rate which the bank of Canada charges to chartered banks

The nominal interest rate is the current rate of borrowing (the real interest rate + inflation)
The real interest rate is the nominal interest rate corrected for changes in purchasing power (so if the current interest rate is 5% and inflation is currently 5%, then the real interest rate is 0% [nominal minus inflation])
----------------------------
EXCHANGE RATES (e): These are the same as they were in micro
Foreign Exchange = Actual Foreign currency
Foreign Exchange Market = The Market for Foreign Currency
External Value = The price of domestic currency
Exchange Rate = The price of foreign currency
Appreciation = rise in external value and fall in the exchange rate (when domestic currency becomes worth more relative to foreign currencies)
Depreciation = fall in external value and rise in exchange rate (when domestic currency becomes worth less relative to foreign currencies)

BALANCE OF PAYMENTS (BOP) = a measure of the money going in and out of any country
BALANCE OF TRADE = Exports minus Imports = net exports = NX

Historically, our imports and exports have both increased over time, but our net exports are positive (The US's net exports are negative right now).

Our exchange rate has fluctuated greatly over time. It's reached parity with the US a few times (like in 2008).

Growth and Fluctuations (Business cycles) are different!

Wednesday, January 6, 2010

Introduction to Macroeconomics

Here we go!

MACROECONOMIC MODELING: There are two different ways to model the economy.

-Bottom up modeling uses all of the principles of microeconomics (such as profit and utility maximization) and analyzes the choices made by workers, firms, consumers, and others to create a model of the economy. A bottom-up model assumes that the economy works, and thus wages and prices are flexible within a bottom-up model.

-Top down modeling is a macroeconomic aggregation (summation) which analyzes the collective behavior of larger groups (as opposed to individual actors). Thus, top down modeling focuses on total demand and supply within an economy, and also assumes wage and price rigidity.

OUR course follows the Top Down approach to macroeconomic modeling. We do not explicitly rely on microeconomic foundations here, and we are initially assuming wage and price rigidity.

REMEMEBER:
-Macroeconomics is concerned with the 'big picture'
-Macroeconomics studies aggregates and how government policy affects them (ie: the government can manipulate the economy)
-The concepts of price and quantity which we learned in Microeconomics now become the general price level (P) and the national income or production or Gross Domestic Product (Y)
-Two issues of major importance are BUSINESS CYCLES and GROWTH of Y

BUSINESS CYCLES: The cycles of the national income in the medium term
GROWTH of Y: The long term trend of national income

Macroeconomics studies FISCAL and MONETARY policy

FISCAL POLICY: Government policies regarding taxation and spending
MONETARY POLICY: Government policies regarding interest rates and the money supply

There are 5 different variables which we have to learn for macroeconomics. Y, U, P, i, & e (we call these the YUPie varaibles in Gateman's class). For each of these different variables, we will be learning what exactly the variable refers to, what historical trends have we observed regarding the variable, and why the variable is important.
-----------------------------------------------
Y: OUTPUT AND INCOME
****REMEMBER: Output generates income!
DEFINITION OF Y: Final market value of all goods and services produced in the economy during a defined period of time (usually a fiscal year).

Final- refers to the fact that intermediate goods do not count towards GPD (so you cannot count both a car and the steel needed to produce that car both as contributors to national income)
Market Value- This refers to the value of products as determined by supply and demand
Good and Services- Both concrete goods (like tomatoes) and immaterial goods (like economics classes) contribute to GDP
Produced in the economy- this refers to the fact that 'flipping' products does not add to the GDP, so a stock broker who makes a small fortune from buying and selling stocks is not technically contributing to the GDP. On the other hand, if this broker were were to create a financial brokerage service for others, this WOULD contribute to the GDP (because the broker could be seen as offering a service to others for money)
A fiscal year in Canada is usually from April of one year until April of the next year, because that is when the government unveils the budget (their plan regarding spending and taxation)

Nation Income (Y) is the 'target' at which we aim the economy- in other words, it is the variable which we seek to manipulate directly in order to make changes to the economy. The government uses fiscal and monetary policy to accomplish this task. Unemployment (U) is inversely related to growth in Y, so as national income grows, unemployment shrinks. Conversely, as the national economy shrinks, unemployment rises. Inflaction (P) is directly related to growth in Y, so as the national income grows, the general price index (aka inflation, aka P) will increase.

Just REMEMEBER THIS:
National income (Y) is the primary target of attempts to manipulate the economy
Unemployment (U) and Inflation (P) are secondary
Interest Rates (i) and Exchange Rates (e) are tertiary

So, in other words, every macroeconomic variable we deal with in this course is affected by national income.
-------------------------------
THE CIRCULAR FLOW DIAGRAM


The red arrow flowing from households to producers represents flow of factors (workers provide factors to producers so that consumers may produce products)
The black arrow flowing from producers to households represents flow of income (producers give workers wages in return for providing labour as a factor of production)
The red arrow flowing from producers to households represents flow of output or goods (households buy products from producers)
The black arrow flowing from households to producers represents flow of expenditures (households pay producers money in order to purchase goods)

The red arrows here show real flows (flows of real goods, services, and factors), while the black arrows should money flows. There are two systems represented here: the output-expenditure flow (also known as the products market) and the factor income flow (also known as the factor market)

IMPORTANT*** GDP(Y) = GDP(E) (income = expenditures)
Also, OUTPUT GENERATES INCOME (so the higher our output, the higher out income)

This basic circular flow structure is called a spendthrift economy.

If we add a bank to the system, we can call it a frugal economy. Here, actors can put money into the bank (this is called savings) and the bank can lend money out to different actors (this is called investment). If the level of savings is equal to the level of investment, then the flow of money doesn't change, and the national income remains at equilibrium (so it is constant over time)

If we add government to the system in addition to a bank, we can call it a governed economy. There difference between a government and a bank is that with a bank, withdrawal and injections of money are voluntary, where as with the government, they are imposed. Taxation is like an imposed version of savings- it takes money out of the economy, while government spending is equivalent to investment, it injects money back into the economy.

If we also add the rest of the world to our economic system, we have an open economy. Here, we can have imports, where domestic consumers purchase foreign goods, and effectively move money out of the economy, and exports where foreign consumers purchase domestic goods and effectively inject money into the economy.

JUST REMEMEBER: for any of these added institutions, as long as all money withdrawals are equal to money injections the GDP is in equilibrium!
----------------------------
GDP - Income
W, R, i, & P all refer to different flows of income- they are the returns for factors of production

W = wages- a return on labour (N)
R = economic rent - a return on land (L)
i = interest - a return on capital (K)
P = economic profits - a return on technology and entrepreneurship (T & E)

GDP - Expenditures
C, I, G, & netX all refer to different flows of expenditure- they are returns for output products (ie: payments for goods and services)

There are four plays in an economy, all of whom must accumulate expenditures

C = Consumption, or expenditures by households
I = Investment, or expenditures by firms
G = Government Expenditure, which is obviously expenditure accumulated by the government
netX = Net exports: in other words, the total number of exports minus the total number of inputs. This is foreign expenditure on domestic goods minus domestic expenditure on foreign goods (X-M).

Y has many many different synonyms. It can refer to:
-national income
-national expenditure
-output
-production
-GDP
-the real thing
-it is a measure of material wealth (the standard of living is the per-capita GDP): this is basically a measure of the material wealth of a nation)

It is NOT, however, a measure of quality of life (money can't necessarily buy happiness).
------------------------
REAL VS. NOMINAL VALUES

Nominal: Actual, current, money, refers to changeable prices and quantities
Real: Constant dollar- here, there are only changes in quantity, while holding the price constant to base year values.

REAL = NOMINAL/PRICE (so real could be the number of cars produced, nominal would be the value of cars produced in 2009, and price would be the price of each car in 2009)

***IN OUR COURSE, WE WILL ALWAYS ASSUME THAT Y IS REAL UNLESS OTHERWISE STATED.
------------------------
OUTPUT GAPS

Potential National Income (Y*) is the maximum achievable output level if all inputs are used at their NORMAL UTILIZATION RATE

Output gap = Y - Y* (actual output level minus potential output level)

If the output gap is negative, then it is a recessionary gap, and the economy is producing at less than its potential
If the output gap is positive, the it is an inflationary gap, and the economy is producing at more than its potential.
-------------------------
THE BUSINESS CYCLE: Changes in Y over real time

4 Stages:
1- Trough (recession/depression)
2- Expansion (boom/recovery)
3- Peak
4- Contraction (slump)

Recessions are downturns in economic growth: two quarters (6 months) of negative growth
Depressions are periods of persistent low growth, high unemployment, and excess capacity

HISTORICALLY, potential output has tripled since 1970, and the output gap is very cyclical (hence business cycles)
Growth varies, but average growth over the last 40 years had been 3.5% per year. Sometimes growth is negative (hence a recession)

WHY DOES NATIONAL INCOME MATTER?
Output gaps concern politicians, because inflation causes high prices which voters do not like, and unemployment also makes voters unhappy. As a result, politicians try to focus on eliminating output gaps.
Economists are more concerned by the potential output. Economic growth is a long term trend we are witnessing: per capita GDP or the standard of living is increasing over time (although this may be deceptive, as standard of living applies only to the average person. In reality, the standard of living may seen reasonable for a country when in reality, there is an enormous wealth gap between the poor and the wealthy).

That's all for today

And So It Begins

I have no notes for macroeconomics as of yet. I'm not making a new blog for macro- just keep reading this one and pretend that the title says 102, and not 101. =)

Good luck to all of us...