Hokay!
Farmers basically experience two kinds of problems which make their lives miserables.
THE LONG TERM PROBLEM is that farmer's incomes fall, relative to the incomes of urban workers. There are three reasons for this.
1: Increasing domestic supply: as time moves on and technologies improve in farming, the domestic supply of farmed products shifts to the right (increases). This wouldn't be necessarily such a bad thing if demand would also shift to the right... however...
2: The is a lagging domestic demand for farm products: Because farm products are necessities (food), they have low income elasticity. As such, increases in income do not cause consumers to purchase much more farm products.
also
3: The is a decreased demand for exported farm goods: There is less of a demand now for Canadian farm products on the global market because countries which we have sold to in the past now produce their own farmed goods domestically.
So basically, demand for farm products remains relatively stagnant, while the supply of farm products increases. This means that the price of farm products inevitally drops, as do farmer incomes.
AGRICULTURE SUPPORT: RAISING INCOME
Government argicultural policy often aims to raise farmer's incomes above what they would make selling goods at equilibrium prices (in addition to stabilizing incomes).
There are two ways to maintain an effective price floor above the equilibrium price
1: PRICE SUPPORT
In price support, the government legislates an effectual price floor, by buying all of a farmer's output at a set price higher than the equilibrium price. By doing this, the government creates a situation where demand is perfectly elastic (and prices will not change regardless of quantity supplied).
The price and quantity exchanged both rise from the orginal equilibrium level. There is, however, an excess in supply (the farmers produce more than customers will actually buy at that set price). Excess supply is stockpiled each year.
The government is subidizing an amount equal to (the artificially inflated price) X (The excess in demand)
The consumer is subsidizing an amount equal to (quantity demanded at inflated prices) X (The difference between the equilibrium price, and the inflated price)
BASICALLY, this method allows farmers to make more money by rellocating money from the consumer and from the taxpayer.
2: QUOTAS
In a quota scenario, the government sets a limit on the quantity of a farm good that is supplied (like a quantity wall). The quota quantity is less than the equilibrium quantity, and as such, the price at the quota quantity is higher than the equilibrium price.
The effect is that quota holders get extra revenue equal to (the difference between the price demanded at the quota quantity and the price supplied at quota quantities)
Because demand is inelastic if for whatever reason quantity falls, farmer's total renevues increase! And quantity cannot rise above the quota level.
Pe X Qe < Pq X Qq BECAUSE OF INELASTIC DEMAND
Advantages: Farmer's income is stabilized without stockpiling
Disadvantages: The consumer pays more for less, and the cost of purchasing quota rights effectually allows quota licenses to become a market in and of themselves.
-----------------------------------
-------------------------------------
----------------------------------------
--------------------------------------------
THE SHORT TERM PROBLEM is that the prices of farm products fluctuate tremendously, and as a result, the farmer has a difficult time securing a steady income. These fluctuations can happen on a few levels.
INTERNATION MARKETS- changes in world prices cause changes in export prices. When the world market goes up or down, farmers make more or less money off of exports.
Basically, the demand in the world market is perfectly elastic, because Canada's contributions to international farm product markets are so small, they are practically insignificant. As a result, whatever quantities Canadian producers put on the international market do not affect the price determined for the product. FARMERS HAVE NO CONTROL OVER FLUCTUATIONS IN WORLD PRICE. Because prices are uncontrollable, farmers incomes increase in the same direction as supply (if the weather is good for some reason and a large crop is harvested, they make more money) and vice versa. Farmer incomes also increase when world prices arbitrarily rise, and fall when world prices fall.
The big complaint for farmers is that they have very little control over their incomes due to these uncontrollable changes in both the world market and their own supply. As a result, the government will often step in and try and fix things.
STABILIZATION POLICIES FOR INTERNATIONAL MARKETS (in order to adjust for fluctuations)
1: Stabilize Quantity!
How? Stockpile farm products when there are too many being produced (a good year), and then dip into this stockpile when there is not enough being produced (a bad year)
Problems: This won't work for perishable items, and also, there are extra costs farmers will have to pay to stockpile their products.
GATEMAN'S AWESOME SUGGESTION: Why not just save extra money made during good years and borrow money lost during bad years (like the rest of us)
2: Stabilize Price!
How? Create a system of 'guarunteed price' where the government subsidizes farmers when world prices are too low, and farmers pay the government when the prices are too high.
Major Problem: How do you determine what prices are too high and which are too low? If the government sets the 'ideal' price at a rate which does not correspond to acceptable world prices, either the government or the farmers will be getting a bad deal.
GATEMAN'S AWESOME SUGGESTION: Why not just save extra money made during good years and borrow money lost during bad years (like the rest of us)
DOMESTIC MARKETS- Basically, supply is inelastic from year to year (farmers can't substitute inputs and change production mid-growing season without much difficulty), and unplanned changes can occur to this inelastic supply due to changes in weather or other uncontrollable factors.
Domestic demand for farm products is very inelastic (there isn't a whole lot of substitution people can make for food). Because price is so inelastic, farmers can ACTUALLY LOSE OVERALL PROFIT by supplied a LARGER QUANTITY THAN EXPECTED (because, remember, total revenue is price X quantity, and for inelastic demand, total revenue increases when you lower quantity exchanged and increase the price). In other words, farmers incomes will fluctuate in the same direction as the price, and in the opposite direction to supply (the higher the price of wheat, the more money wheat farmers will make), and exogenous factors can raise or lower the price of wheat (by changing the quantity supplied)
HOKAY! Farmers hate this because again, they have no control over their own incomes.
THIS IS WHAT THE GOVERNMENT DOES!
1: Stabilize Quantity!
How? Stockpile farm products when there are too many being produced (a good year), and then dip into this stockpile when there is not enough being produced (a bad year)
Problems: This won't work for perishable items, and also, there are extra costs farmers will have to pay to stockpile their products.
GATEMAN'S AWESOME SUGGESTION: Why not just save extra money made during good years and borrow money lost during bad years (like the rest of us)
2: Stabilize Price!
How? Create a system of 'guarunteed price' where the government subsidizes farmers when world prices are too low, and farmers pay the government when the prices are too high.
Major Problem: How do you determine a good average price? Also, farm income will still vary with the quantity supplied.
GATEMAN'S AWESOME SUGGESTION: Why not just save extra money made during good years and borrow money lost during bad years (like the rest of us)
3: Suggestions for income stabilization in domestic markets:
-With too little government intervention, farmer incomes will vary inversely with supply. (The artificial demand curve is too inelastic)
-With too much government intervention, farmer incomes will vary directly with supply. (The artificial demand curve is too elastic)
-So in order to be most effective, the government tries to intervene in an intermediate fashion by providing unit elasticity. In other words, the government's 'guaranteed' price for farm products will vary in an inverse proportion to the quantity.
FOR EXAMPLE: If output rises 10%, the government allows the 'guaranteed price' to fall 10%, so total revenue remains unchanged.
Agricultural Policies in CANADA:
1: DIFFERENT KINDS OF MARKETING BOARDS
a) Supply Management (which is a marketing board)
-sets quotas
-used for milk, eggs, cheese, butter, and poultry
-they are provincial bodies
-they allow for huge profits for farmers... at the expense of the consumer
-Food processor (who buy farm products as inputs) also incur high costs
-In 1995, the quotas were replaced tariff equivalents in order to conform with the World Trade Organization. The tariffs were set as high at 300% though, so our farmers are still making a lot of money
b) Marketing Agents
-The Canadian Wheat Board in an example of this
-Every farmer is required to sell all of their wheat to the Canadian wheat board
-The wheat board pays the farmer the world price for their wheat
2: INCOME SUPPLEMENTS
"Farm safety net programs"
-Crop failure insurance
-Income stabilization
-Bailouts
Farms are pretty big businesses... small farmers are pretty much a thing of the past. =(
ISN'T IT DEPRESSING!?
Wednesday, September 30, 2009
Monday, September 28, 2009
ECON 101 - Markets in Action
Important Announcement: The Midterm is one week away! Here's a quick review of what we've been doing.
Chapter 1: What is economics?
Chapter 2: What is a social science/how do research and statistics work?
Chapter 3: What are demand and supply curves?
Chapter 4: We describe demand and supply curves
Chapter 5: We apply demand and supply curves
STUDY ECONOMICS! Your Marks depend on it!
If you hit the ground running, you will do well!
It really doesn't matter how you study as long as you understand the material.
Okay!
--------------------
Examples/Applications of supply and demand
-Interaction among markets
-Government controlled prices
-Market Efficiency
INTERACTION AMONG MARKETS
-Basically, changes in one market will affect other markets. There is also a degree of feedback, so changes in a market can cause it to change again.
For an example, if a technology develops which makes it much cheaper and faster to extract oil, the supply of oil will move to the right (oil's supply will rise). This in turn causes all markets which use oil as an input (such as plastics or transportation) in turn to experience and increase in supply. At the same time, as supply of oil increases, equilibrium price of oil will fall, which in turn will effect the demand of oil substitutes such as natural gas or wind power.... you get the point?
There are two ways of looking at markets
PARTIAL EQUILIBRIUM- analysis of a market in isolation (other markets aren't taken into account)
GENERAL EQUILIBRIUM- All of the markets are taken into account
In this course, we are considering markets almost exclusively from a partial equilibrium standpoint.
----------------------------------
GOVERNMENT CONTROLLED PRICES
When the price is in disequilibrium, the ACTUAL AMOUNT exchanged is always the LESSER/SMALLER of the quantity supply or the quantity demanded. This is the small numbers rule!

PRICE FLOORS: A minimum price. Prices are not allowed to fall below a set amount.
They have no effect UNLESS they are set above the equilibrium price. Otherwise, the market will simply fall into equilibrium, like it regularly does.
A binding price floor creates an excess supply!
PRICE CEILING: A maximum price. Prices are not allowed to rise above a set amount.
They have no effect unless UNLESS they are set below the equilibrium price.
In most cases with price ceilings, a shortage is created (an excess of demand). Those who are able to get their hands on the product get it for a cheap price, but everyone else is simply denied the product.
IF YOU SCREW WITH MARKETS, THERE IS ALWAYS A COST! DUN DUN DUN...
Basically, if price controls prevent markets from allocating goods, other allocation methods will spring up.
-Black Markets (illegal markets in which black marketeers buy products at controlled prices, and then sell them at the prices which consumers are willing to pay for them, making personal and illegal profits off of the difference)
-First come, first served (so people will cue up to get products. Think UBC BBQs)
-Rationing (the government decides how much each consumer gets to purchase. This happens during wars usually)
-Seller Preferences (Under the counter deals for favorite customers or family)
Okay!
-----------
RENT CONTROL
(otherwise known as an effective price ceiling)
Basically, supply is inelastic in the short run, because it takes time to build new apartments, or to let existing apartments go to ruins.
Rent controls cause excess demand equal to the difference between the quantity which would actually be demanded at the rent control price (a large quantity. if pricing is cheap, people want more of it) and the quantity supplied at that price range. This may not be a large excess of demand initially, but as time passes and the housing market becomes more elastic, buildings will not be kept up, and as a result, they will become uninhabitable. This means that supply will actually decrease over time, creating a larger excess of demand (housing shortage).
The moral of the story: Those who get tenancy before the price controls are adopted WIN, because they have cheap rent forever (but on the other hand, their building may not be kept well if the owner is making a loss on it due to artificially cheapened rent). Landlords and prospective future tenants both lose. Landlords lose because they don't get the expected returns on their investment in real estate, and potential tenants lose because there aren't enough available buildings for them to find a place to rent from.
As a result...
-Black Market (This is the rent... and then you also have to pay a $1600 key deposit. HAHAHAHA)
-First come first served
-Rationing
-Seller preference (I only rent to my relatives)
MINIMUM WAGES
these are effective price floors for labor. They create an excess of supplied labor, which is otherwise known as unemployment.
The moral: Workers who can keep their jobs win (but not entirely, because they will be expected to perform the duties normally performed by a slightly larger staff). Producers and prospective employees lose. Producers have to pay more, and potential employees can't find a job.
ALTERNATIVES TO PRICE CONTROLS
1: Let the market work
2:
-Subsidized housing
-Public housing
-Income assistance
in other words, just directly give people the money. These are nonmarket solutions. They do not, however, change the fact that opportunity cost for certain goods (such as houses) is high.
How do you balance everything off? There are benefits and downfalls to every scenario where prices are controlled. Do the benefits to those who receive them outweigh the costs to those who incur them in every price control scenario? How do we figure this all out?
MARKET EFFICIENCY: Let's us see if the market is maximizing social welfare.
In order to understand market efficiency, we first need to come to a new understanding of supply and demand. Basically, we morph the demand curve into a benefit curve, and the supply curve into a cost curve.
DEMAND is the maximum price a consumer is willing to pay for any given quantity. If there is less supplied, the consumer is willing to pay more.
in this sense, MAXIMUM PRICE = value, or benefit to you, the consumer.
SUPPLY is the minimum price a producer is willing to accept for the sale of a good. The less they are selling, the less they are willing to sell for.
ECONOMIC SURPLUS = BENEFIT - COST

Let's say I am willing to buy a can of coke for $1, and a company is willing to sell it for ten cents! Well... then basically, when we buy and sell at equilibrium price, the consumers are getting bonus profit, and consumers are getting a lower price than the maximum they are willing to pay, so there is an economic surplus spread through the market to both consumers and producers. The dollar amount of this surplus can be determined by finding the area of the triangle which represents the surplus on a market graph.
The producer surplus is the part of the triangle above the equilibrium price point
The consumer surplus is the part of the triangle below the equilibrium price point
Economic surplus is FREE HAPPINESS!
We don't want to cut that surplus, because that creates losses... however some create total losses, but net benefits for either producers or suppliers
PRICE CEILINGS create losses in the producer surplus, losses in the total surplus, and increases in the consumer surplus.
PRICE FLOORS create losses in the consumer surplus, losses in the total surplus, and increases in the producer surplus.
The chunk which is taken out of the triangle (to the right of the price control quantity exchanged) represents the net loss in economic surplus. That is the cost of intervention.
Chapter 1: What is economics?
Chapter 2: What is a social science/how do research and statistics work?
Chapter 3: What are demand and supply curves?
Chapter 4: We describe demand and supply curves
Chapter 5: We apply demand and supply curves
STUDY ECONOMICS! Your Marks depend on it!
If you hit the ground running, you will do well!
It really doesn't matter how you study as long as you understand the material.
Okay!
--------------------
Examples/Applications of supply and demand
-Interaction among markets
-Government controlled prices
-Market Efficiency
INTERACTION AMONG MARKETS
-Basically, changes in one market will affect other markets. There is also a degree of feedback, so changes in a market can cause it to change again.
For an example, if a technology develops which makes it much cheaper and faster to extract oil, the supply of oil will move to the right (oil's supply will rise). This in turn causes all markets which use oil as an input (such as plastics or transportation) in turn to experience and increase in supply. At the same time, as supply of oil increases, equilibrium price of oil will fall, which in turn will effect the demand of oil substitutes such as natural gas or wind power.... you get the point?
There are two ways of looking at markets
PARTIAL EQUILIBRIUM- analysis of a market in isolation (other markets aren't taken into account)
GENERAL EQUILIBRIUM- All of the markets are taken into account
In this course, we are considering markets almost exclusively from a partial equilibrium standpoint.
----------------------------------
GOVERNMENT CONTROLLED PRICES
When the price is in disequilibrium, the ACTUAL AMOUNT exchanged is always the LESSER/SMALLER of the quantity supply or the quantity demanded. This is the small numbers rule!
PRICE FLOORS: A minimum price. Prices are not allowed to fall below a set amount.
They have no effect UNLESS they are set above the equilibrium price. Otherwise, the market will simply fall into equilibrium, like it regularly does.
A binding price floor creates an excess supply!
PRICE CEILING: A maximum price. Prices are not allowed to rise above a set amount.
They have no effect unless UNLESS they are set below the equilibrium price.
In most cases with price ceilings, a shortage is created (an excess of demand). Those who are able to get their hands on the product get it for a cheap price, but everyone else is simply denied the product.
IF YOU SCREW WITH MARKETS, THERE IS ALWAYS A COST! DUN DUN DUN...
Basically, if price controls prevent markets from allocating goods, other allocation methods will spring up.
-Black Markets (illegal markets in which black marketeers buy products at controlled prices, and then sell them at the prices which consumers are willing to pay for them, making personal and illegal profits off of the difference)
-First come, first served (so people will cue up to get products. Think UBC BBQs)
-Rationing (the government decides how much each consumer gets to purchase. This happens during wars usually)
-Seller Preferences (Under the counter deals for favorite customers or family)
Okay!
-----------
RENT CONTROL
(otherwise known as an effective price ceiling)
Basically, supply is inelastic in the short run, because it takes time to build new apartments, or to let existing apartments go to ruins.
Rent controls cause excess demand equal to the difference between the quantity which would actually be demanded at the rent control price (a large quantity. if pricing is cheap, people want more of it) and the quantity supplied at that price range. This may not be a large excess of demand initially, but as time passes and the housing market becomes more elastic, buildings will not be kept up, and as a result, they will become uninhabitable. This means that supply will actually decrease over time, creating a larger excess of demand (housing shortage).
The moral of the story: Those who get tenancy before the price controls are adopted WIN, because they have cheap rent forever (but on the other hand, their building may not be kept well if the owner is making a loss on it due to artificially cheapened rent). Landlords and prospective future tenants both lose. Landlords lose because they don't get the expected returns on their investment in real estate, and potential tenants lose because there aren't enough available buildings for them to find a place to rent from.
As a result...
-Black Market (This is the rent... and then you also have to pay a $1600 key deposit. HAHAHAHA)
-First come first served
-Rationing
-Seller preference (I only rent to my relatives)
MINIMUM WAGES
these are effective price floors for labor. They create an excess of supplied labor, which is otherwise known as unemployment.
The moral: Workers who can keep their jobs win (but not entirely, because they will be expected to perform the duties normally performed by a slightly larger staff). Producers and prospective employees lose. Producers have to pay more, and potential employees can't find a job.
ALTERNATIVES TO PRICE CONTROLS
1: Let the market work
2:
-Subsidized housing
-Public housing
-Income assistance
in other words, just directly give people the money. These are nonmarket solutions. They do not, however, change the fact that opportunity cost for certain goods (such as houses) is high.
How do you balance everything off? There are benefits and downfalls to every scenario where prices are controlled. Do the benefits to those who receive them outweigh the costs to those who incur them in every price control scenario? How do we figure this all out?
MARKET EFFICIENCY: Let's us see if the market is maximizing social welfare.
In order to understand market efficiency, we first need to come to a new understanding of supply and demand. Basically, we morph the demand curve into a benefit curve, and the supply curve into a cost curve.
DEMAND is the maximum price a consumer is willing to pay for any given quantity. If there is less supplied, the consumer is willing to pay more.
in this sense, MAXIMUM PRICE = value, or benefit to you, the consumer.
SUPPLY is the minimum price a producer is willing to accept for the sale of a good. The less they are selling, the less they are willing to sell for.
ECONOMIC SURPLUS = BENEFIT - COST
Let's say I am willing to buy a can of coke for $1, and a company is willing to sell it for ten cents! Well... then basically, when we buy and sell at equilibrium price, the consumers are getting bonus profit, and consumers are getting a lower price than the maximum they are willing to pay, so there is an economic surplus spread through the market to both consumers and producers. The dollar amount of this surplus can be determined by finding the area of the triangle which represents the surplus on a market graph.
The producer surplus is the part of the triangle above the equilibrium price point
The consumer surplus is the part of the triangle below the equilibrium price point
Economic surplus is FREE HAPPINESS!
We don't want to cut that surplus, because that creates losses... however some create total losses, but net benefits for either producers or suppliers
PRICE CEILINGS create losses in the producer surplus, losses in the total surplus, and increases in the consumer surplus.
PRICE FLOORS create losses in the consumer surplus, losses in the total surplus, and increases in the producer surplus.
The chunk which is taken out of the triangle (to the right of the price control quantity exchanged) represents the net loss in economic surplus. That is the cost of intervention.
Friday, September 25, 2009
Eco 101 Income and Cross Elasticity
Here's a quick review of what we know.
Elasticity is basically the responsiveness of demand to changes in price.
There are three equations for elasticity. They all work.
Relative Change in Demand/Relative Change in Price
/\ Q / Avg Q
/\ P / Avg P
(Avg P / Avg Q) X (1 / Slope)
INCOME ELASTICITY OF DEMAND IS EXACTLY THE SAME, except instead of responding to changes in Price, demand is responding to changes in Income. As such, we use 'Y' instead of 'P' in the formula
Relative Change in Demand/Relative Change in Price
/\ Q / Avg Q
/\ Y / Avg Y
(Avg Y / Avg Q) X (1 / Slope)
There are two main kinds of goods which are affected by changes in income in different ways.
Normal goods are items which respond positively to changes in income. If your income increases, you buy more of them. As your income decreases, you buy less of them. These include items such as cars or food.
Inferior goods are abnormal goods (although not necessarily of lower quality) which repond negatively to income changes. You buy less of them as your income increases, and more of them as your income decreases. This includes things like Wal-Mart shoes and craft dinner, but it is also dependent on personal tastes. Some inferior goods may be consumed less as income increases, because education also increases as income increases, and these products are considered unhealthy.
LUXURY: Movies (3.5) Electricity (2.0) Autos (1.0) --------> Elasticity is greater than 1
NECESSITIES: Furniture (0.5) Clothing (0.5) Food (0.2)-----> Elasticity is less than 1, but still positive
INFERIOR: Whole Milk (-0.5) Pig Products (-0.2)---------> Elasticity is negative
There are two factors which determine the elasticity of income:
1: Characteristics of the good
2: Taste Preferences
The nature of the good itself will define elasticity, but often, preferences will determine the necessity level of a good. Often, as income increases, there is a move away from staple foods to produce and meats, to restaurant meals.
CROSS ELASTICITY OF DEMAND: The sensitivity of demand in one product to price changes of another product
Relative Change in Demand for Product X/Relative Change in Price for Product Y
/\ QX / Avg QX
/\ PY / Avg PY
(Avg PY / Avg QX) X (1 / Slope)
There are two different scenarios here:
COMPLIMENTARY GOODS: Eg, CDs and Walkman Players
THESE HAVE A NEGATIVE CORRELATION
In other words, the cross elasticity of demand for complimentary goods is negative.
SUBSTITUTE GOODS: EG, Pepsi and Coke
THESE HAVE A POSITIVE CORRELATION
In other words, the cross elasticity of demand for substitute goods is positive
Here is a case scenario which could make us think about the cross elasticity of substitute goods. Gateman was, at one point, down in Ottawa to study this case. Here, Fritto-Lay (a subsidiary of Pepsico) was essentially buying out Hostess Chips (through a multimillion dollar merger). The government saw that this was essentially the creation of a monopoly in the potato chip industry, and rushed in to prevent the merger. The company lawyers for Fritto-Lay, however, were able to conclusively prove that the merger would not, in effect, create a monopoly, because in real markets, other goods such as popcorn and cheese puffs serve as de facto substitute goods for potato chips. Potato chips have a higher cross elasticity of demand with these substitute snack foods, so as a result, Fritto-lay would not be able to create a real market monopoly. Frito-Lay naturally won the case and was allowed the merger..... Hooray!
Wednesday, September 23, 2009
Econ-101-Elasticity continues
Announcements: It's flu season, apparently. If you're sick, don't show up. It's that simple!
Review:
Elasticity of Demand: The sensitivity of quantity demanded to changes in price
Relative change in Q
Relative change in P
or
/\Q / Average Q
/\P / Average P
or
(Average P / Average Q) X (1 / Slope)
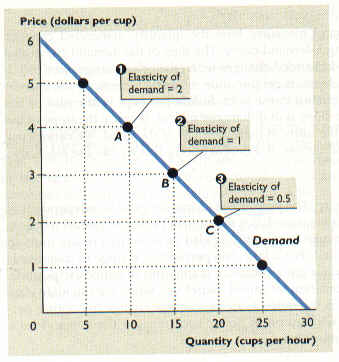
It's an oversimplification, but flat demand is more elastic, and steep demand is less elastic. This is due to the increase or decrease in inverted slope
Also, more right-shifted demand curves are less elastic than left-shifted demand curves. This is due to the increase or decrease in average quantity demanded at any price
HOKAY!
Why do we get different sensitivity rates to price changes (elasticity rates) for different products?
Why are certain firms able to get away with 'jacking up the price' of certain products?
THE ANSWER:
Different degrees of availability of substitutes products (outputs on the demand side) effect elasticity. The more options, and higher the quality of available substitutes, the easier it will be for consumers to simply buy a substitute product if the price of a good increases. This means that it is easier for consumers to respond to price changes by lowering or heightening demand for products with many viable substitutes...
MORE SUBSTITUTES = HIGHER ELASTICITY
The more specific a product is, the higher elasticity will be.
Coke is much more elastic as a good than 'pop'
Pop is much more elastic as a good than 'fluids'
TIME PERIOD EFFECTS THINGS
Over time, competition increases, the availability of substitutes increases, and elasticity increases.
PERCEPTION ALSO EFFECTS THINGS
products viewed as 'luxury' items will simply not be purchased if their price is raised. How consumers perceive products effects elasticity.
HOKAY Time for comparisons
NAME SHAPE ELASTICITY REASON
perfectly inelastic vertical line 0 demand never changes with price
inelastic steep line less than 1 /\ Q < /\ P
unit elastic rectangular hyperbola 1 /\ Q = /\ P
elastic flat line more than 1 /\ Q > /\ P
perfectly elastic horizontal line infinite price never changes with demand
THE PRICE ELASTICITY OF SUPPLY!
-the responsiveness of supply to changes in price
-the formulas are the same...
HOWEVER, unit elasticity is a straight line through the origin, not a rectangular hyperbola. Why- ask Jude Drutz!
Here, elasticity is determined by the availability of substitute inputs!
The more viable substitute factors of production you have to work with as a producer, the more elastic the supply if your product will be.
EG: you farm wheat and oats. It is fairly easy to divert production towards wheat if the price of wheat increases, because wheat is a substitute input for many other grain products, it is also easy to divert production away from wheat, because it uses the same machinery and land as other substitute crops. SO WHEAT has a high price elasticity of supply.
Durin fruit is difficult and unique to farm. It requires a very specific method to cultivate and harvest, which is not used to cultivate other fruits. It is very difficult to change the production quantity of Durin in response to price changes, so Durin has low elasticity.
FIN
Review:
Elasticity of Demand: The sensitivity of quantity demanded to changes in price
Relative change in Q
Relative change in P
or
/\Q / Average Q
/\P / Average P
or
(Average P / Average Q) X (1 / Slope)
It's an oversimplification, but flat demand is more elastic, and steep demand is less elastic. This is due to the increase or decrease in inverted slope
Also, more right-shifted demand curves are less elastic than left-shifted demand curves. This is due to the increase or decrease in average quantity demanded at any price
HOKAY!
Why do we get different sensitivity rates to price changes (elasticity rates) for different products?
Why are certain firms able to get away with 'jacking up the price' of certain products?
THE ANSWER:
Different degrees of availability of substitutes products (outputs on the demand side) effect elasticity. The more options, and higher the quality of available substitutes, the easier it will be for consumers to simply buy a substitute product if the price of a good increases. This means that it is easier for consumers to respond to price changes by lowering or heightening demand for products with many viable substitutes...
MORE SUBSTITUTES = HIGHER ELASTICITY
The more specific a product is, the higher elasticity will be.
Coke is much more elastic as a good than 'pop'
Pop is much more elastic as a good than 'fluids'
TIME PERIOD EFFECTS THINGS
Over time, competition increases, the availability of substitutes increases, and elasticity increases.
PERCEPTION ALSO EFFECTS THINGS
products viewed as 'luxury' items will simply not be purchased if their price is raised. How consumers perceive products effects elasticity.
HOKAY Time for comparisons
NAME SHAPE ELASTICITY REASON
perfectly inelastic vertical line 0 demand never changes with price
inelastic steep line less than 1 /\ Q < /\ P
unit elastic rectangular hyperbola 1 /\ Q = /\ P
elastic flat line more than 1 /\ Q > /\ P
perfectly elastic horizontal line infinite price never changes with demand
THE PRICE ELASTICITY OF SUPPLY!
-the responsiveness of supply to changes in price
-the formulas are the same...
HOWEVER, unit elasticity is a straight line through the origin, not a rectangular hyperbola. Why- ask Jude Drutz!
Here, elasticity is determined by the availability of substitute inputs!
The more viable substitute factors of production you have to work with as a producer, the more elastic the supply if your product will be.
EG: you farm wheat and oats. It is fairly easy to divert production towards wheat if the price of wheat increases, because wheat is a substitute input for many other grain products, it is also easy to divert production away from wheat, because it uses the same machinery and land as other substitute crops. SO WHEAT has a high price elasticity of supply.
Durin fruit is difficult and unique to farm. It requires a very specific method to cultivate and harvest, which is not used to cultivate other fruits. It is very difficult to change the production quantity of Durin in response to price changes, so Durin has low elasticity.
FIN
Monday, September 21, 2009
Econ 101 -> Elasticity: How responsive is the quantity demanded to a change in price?
BC is harmonizing PST & GST into a 12% harmonized sales tax. This means that our tax base is larger (we're going to be taxed fully on more items). Yeeech.
Some politicians have been saying that businesses will pass on their savings to consumers. Prof G. thinks this is rubbish! Why? We will discover and be able to explain it by the end of the week (which is very exciting
1: Price elasticity of Demand
2: Price elasticity of Supply
3: Income elasticity of Demand
4: Cross elasticity of demand
5: Note on Point Elasticity
Price (bottom) elasticity of demand (top): PeD (e will look like n, which is a greek letter eta)
BASICALLY, when we are talking about demand curves, there are two significant factors which we need to take into account when measuring elasticity: LOCATION of the curve, and INCLINATION (slope) of the curve.
Visually, elasticity is a measure of both the location and inclination of a curve. In reality, elasticity is a measure of how responsive the quantity demanded is to a change in price. High elasticity means that demand is highly responsive to price changes. Low elasticity means that demand is not very responsive to price changes.
The formula!
Elasticity = (Average Price/Average Quantity Demanded) X (1/Slope)
Elasticity = Average Change in quantity demanded / relative change in price
It's sort of like an inverted slope, in a sense, but with other factors.
WE WANT TO KNOW THE RELATIVE CHANGE, because the impact of a change depends on its context. 1$ raise is huge if you only make 50 cents per hours. It is negligible if you make 600 dollars per hour. This is why both slop and location are a factor. We use average price and average quantity demanded because if we used only the starting or ending points of an arc to measure elasticity, it would be inaccurate.
Price -bottom- elasticity of Demand -top-
/\Q / Avg Q
/\ P / Avg P

Average Quantity demanded is higher for the curve on the right, so the elasticity will be smaller.

Flatter lines are more elastic, because their inverted slope is greater.
More next time. We are still thrashing this all out.
IMPORTANT: there are lots of formulas out there. whenever possible, just use average prices, average quantity demaned, and slope. It simplifies things!
Some politicians have been saying that businesses will pass on their savings to consumers. Prof G. thinks this is rubbish! Why? We will discover and be able to explain it by the end of the week (which is very exciting
1: Price elasticity of Demand
2: Price elasticity of Supply
3: Income elasticity of Demand
4: Cross elasticity of demand
5: Note on Point Elasticity
Price (bottom) elasticity of demand (top): PeD (e will look like n, which is a greek letter eta)
BASICALLY, when we are talking about demand curves, there are two significant factors which we need to take into account when measuring elasticity: LOCATION of the curve, and INCLINATION (slope) of the curve.
Visually, elasticity is a measure of both the location and inclination of a curve. In reality, elasticity is a measure of how responsive the quantity demanded is to a change in price. High elasticity means that demand is highly responsive to price changes. Low elasticity means that demand is not very responsive to price changes.
The formula!
Elasticity = (Average Price/Average Quantity Demanded) X (1/Slope)
Elasticity = Average Change in quantity demanded / relative change in price
It's sort of like an inverted slope, in a sense, but with other factors.
WE WANT TO KNOW THE RELATIVE CHANGE, because the impact of a change depends on its context. 1$ raise is huge if you only make 50 cents per hours. It is negligible if you make 600 dollars per hour. This is why both slop and location are a factor. We use average price and average quantity demanded because if we used only the starting or ending points of an arc to measure elasticity, it would be inaccurate.
Price -bottom- elasticity of Demand -top-
/\Q / Avg Q
/\ P / Avg P
Average Quantity demanded is higher for the curve on the right, so the elasticity will be smaller.
Flatter lines are more elastic, because their inverted slope is greater.
More next time. We are still thrashing this all out.
IMPORTANT: there are lots of formulas out there. whenever possible, just use average prices, average quantity demaned, and slope. It simplifies things!
Wednesday, September 16, 2009
Econ 101 Real Lecture #3
1: The test email worked! =D
2: True Room Numbers: Mine is at Hebb 12. I have emailed by TA to double check this!
DEMAND: The quantity the consumer is willing to purchase, given the price, Ceteris Paribus!
We all know what the ceteris paribus variables are... so now it's time for...
SUPPLY!
This is more challenging because it is more difficult to psychologically envision being a supplier.
Quantity Supplied: The quantity a firm is WILLING to sell, given the price, Ceteris Paribus
BASICALLY, as the price of a product increases, so does the quantity supplied.
$1.00 -> 7 desired sales
$0.80 -> 6 desired sales
etc. It makes sense. Suppliers want to maximize profits, so the higher a product will sell for, the more of then they would like to sell!
Four Factors:
-The firm is involved, so this is supply-side
-What is being measured is what supplied would LIKE to sell, not what is actually sold
-Quantity Supplied is dependent on price
-Ceteris Paribus
COST is the only real ceteris paribus variable. Basically, all of the other ceteris paribus variables will affect the cost of inputs required to create the product being sold. You can figure out how they affected them by using your logical brain.
(More suppliers creates less supply, ironically) (But I have to double check that)
Complimentary products are different here. Instead of just being products that go well together, they are products that you can easily produce/extract together. An example of this is oil and gas, or meat and gelatin (different parts of the same cow). Basically, as the price of gelatin goes down, the quantity supplied of gelatin goes down, and the quantity supplied of beef will also go down.
Substitute products are products where resources could go into producing one or the other, but must be allocated. An example is wheat and barley in a farmer's field. If the price of Barley goes up, the quantity supplied of barley will increase, and as such, there will be less room left in the field to plant wheat, and less resources available to harvest the wheat, so the quantity supply of wheat will decrease!
Super-easy, right? Let's see some graphs

I stole this from some other prof's online resource package, and I'm terribly sorry. This is the shape most supply curves take.
MOVEMENT:
If prices changes, SUPPLY does not change. The curve stays put. We simply look at the new price and use the graph to find a new point of demand supplied which corresponds to the price.
HOKAY: SHIFTS: There is a process to figuring them out.
Let's say the liberal government increases minimum wage (aka, they increase the cost of output)
1: Is this a shift or a movement? Well it's not a change in price or quantity, so it must be a SHIFT and not a movement along the graph
2: Does it affect demand or supply (if it affects cost, it usually affects demand)? Well the minimum wage raise creates higher costs for producers, so it affects supply.
3: How does it affect supply? It's going to raise the cost of inputs, which in turn means that supply will decrease
4: Graphically Represent this: The curve shifts to the left

Try this with other problems!
JUST REMEMBER: The buyer and seller don't know each other yet. They are on different graphs.
2: True Room Numbers: Mine is at Hebb 12. I have emailed by TA to double check this!
DEMAND: The quantity the consumer is willing to purchase, given the price, Ceteris Paribus!
We all know what the ceteris paribus variables are... so now it's time for...
SUPPLY!
This is more challenging because it is more difficult to psychologically envision being a supplier.
Quantity Supplied: The quantity a firm is WILLING to sell, given the price, Ceteris Paribus
BASICALLY, as the price of a product increases, so does the quantity supplied.
$1.00 -> 7 desired sales
$0.80 -> 6 desired sales
etc. It makes sense. Suppliers want to maximize profits, so the higher a product will sell for, the more of then they would like to sell!
Four Factors:
-The firm is involved, so this is supply-side
-What is being measured is what supplied would LIKE to sell, not what is actually sold
-Quantity Supplied is dependent on price
-Ceteris Paribus
COST is the only real ceteris paribus variable. Basically, all of the other ceteris paribus variables will affect the cost of inputs required to create the product being sold. You can figure out how they affected them by using your logical brain.
(More suppliers creates less supply, ironically) (But I have to double check that)
Complimentary products are different here. Instead of just being products that go well together, they are products that you can easily produce/extract together. An example of this is oil and gas, or meat and gelatin (different parts of the same cow). Basically, as the price of gelatin goes down, the quantity supplied of gelatin goes down, and the quantity supplied of beef will also go down.
Substitute products are products where resources could go into producing one or the other, but must be allocated. An example is wheat and barley in a farmer's field. If the price of Barley goes up, the quantity supplied of barley will increase, and as such, there will be less room left in the field to plant wheat, and less resources available to harvest the wheat, so the quantity supply of wheat will decrease!
Super-easy, right? Let's see some graphs
I stole this from some other prof's online resource package, and I'm terribly sorry. This is the shape most supply curves take.
MOVEMENT:
If prices changes, SUPPLY does not change. The curve stays put. We simply look at the new price and use the graph to find a new point of demand supplied which corresponds to the price.
HOKAY: SHIFTS: There is a process to figuring them out.
Let's say the liberal government increases minimum wage (aka, they increase the cost of output)
1: Is this a shift or a movement? Well it's not a change in price or quantity, so it must be a SHIFT and not a movement along the graph
2: Does it affect demand or supply (if it affects cost, it usually affects demand)? Well the minimum wage raise creates higher costs for producers, so it affects supply.
3: How does it affect supply? It's going to raise the cost of inputs, which in turn means that supply will decrease
4: Graphically Represent this: The curve shifts to the left
Try this with other problems!
JUST REMEMBER: The buyer and seller don't know each other yet. They are on different graphs.
Friday, September 11, 2009
First Lecture
Economic Issues and Concepts:
Proff G uses brainwaves, which are obvious and powerful things to know within the course. They are obvious, logical, and fundamental.
Efficiency principle for example. Efficient things are better than inefficient things. Simple, non?
Often in the class, you will have to ask yourself 'what part of what I know will help me answer the question- this is problem solving skills, which you will have to develop.
Article->Question->Which Component of the course do I use.
The Outlines HELP ORGANIZE IT ALL
HOKAY!
Markets are self-organizing. For an example, you have 4 chicks in a nest, and 2 worms. Who gets the worm? This is an example of scare resources (2 worms) which must be distributed amongst competing uses (4 chicks)
Modern free markets solve this problem on their own. You don't have to run things, they run themselves. Adam smith wrote Wealth of Nations in 1776, and there is a nice quote which basically equates to the fact that we rely on others' self interest to bring us the things we require in life (goods and services). You can be both kind and self-interested. Self interest is not a 'bad thing'.
The invisible hand, coined by Adam Smith, is the market.
Command Markets can get it wrong which is wasteful and inefficient. Boot overproduction would be a waste of effort.
Effecieny: How much bang for your buck are out getting. Output/Input.
Marx observed that markets are good at allocating resources. He, however, believed that markets were not fantastic at distributing income in a fair way. He saw that it was not equal; that the workers got practically nothing. He suggested that there is a need for 'big brother' to determine who should get stuff... Yah!
Intervention Principal!
Here are the characteristics of a free market
1: rational self interest:
People are rational
People love themsleves
Decisions are smaller: Marginal benefits must outweigh marginal costs in order for someone to buy something.
2: Incentives:
People respond to incentives.
3: Prices and Quantities
4: Markets are governed by 'rules of the game'
Laws (Property and Contract Laws are big)
Institutions
Manners, Customs, Conventions: Many markets are based on trusts (Japan they need to establish trust; US they sue each other)
Scarcity -> There isn't enough to fill your desire.
Economics is the study of how we manage the worms going to the chicks
Scare resources satisfying UNLIMITED WANT (Is this natural? Do we really need more of everything? We could stop demanding more and more...)
Resources = Factors = Inputs
Outputs = Goods and Services
INPUT: Milk, Mango, Elctricity ---> Production--->OUTPUT: Mango smoothie--->Consumption---> Happiness (Utility)
5 Factors of production:
Capital
Land
Labour
Technological Changes
Entrepreneurship
BUT THEY ARE SCARCE, so we have to make a choice as to what we will do with them.
Politics decides among the unlimited desires.
Goods -> cars
Services -> Haircuts
Choice tradeoff: people make decisions as a tradeoff.
Microeconomics analyzes the decision making: how do you make a choice?
We measure things by their opportunity cost: The value/cost of anything is what you give up to get it (AKA what is the next best alternative that you would have done otherwise?)
Guatamala trip = $4000 O.C.
$2000 for the actual trip, and $2000 in lost wages.
Sunk Costs are costs incurred in the past, and they cannot be recovered, so they are therefore irrelevant. So the past is irrelevant?
If you were waiting for 1 hour, should you have and start walking, or should you wait one more minute?
PPC graphs.
Illustrate 3 concepts. We know this.
But why is it concave.....
Thats all folks
Is there anything which actually is not scarce? Yah- New Ideas aren't scarce! Almost everything else is.
Subscribe to:
Posts (Atom)