Sunday, April 18, 2010

Trade Policy

This chapter looks at the policies which either facilitate or impede free trade in the world!

As economists, we usually are in favor of free trade. We recognize that free trade offers many benefits to different countries!

Why is free trade a good idea?
-The law of comparative advantage
-When there is regional specialization and trade, the world production of all products rises
-This maximizes the world's average standard of living (world GDP per capita)

On the other hand, some countries may attempt to instill protectionist policies (policies which counteract free trade in order to protect domestic firms from international competition). These can include both TARIFFS and NON TARIFF BARRIERS (NTBs, such as quotas, customs procedures, anti-dumping duties and countervailing duties).

Why might nation choose certain degrees of protectionism?

REASONS WHICH RELATE TO MAXIMIZING NATIONAL INCOME

1: To improve the terms of trade! If a country is large enough, it can force the world price downward for goods it imports by imposing a Tariff

2: Infant Industry Protection. Some countries may set up trade barriers in order to protect domestic firms from international competition, with the hopes that these industries will grow to the point where they can realize economies of scale. The idea here is that under protection, infant industries will eventually "grow up" to the point where they will be able to compete on the international market without need of protectionism. A problem with this is that not all industries develop to this level of competency while under protection. Canada's national policy of 1876 was an example of infant industry protection directed at improving Canadian manufacturing.

3: Learning by doing. This sort of goes along with infant industry protection, but along with protecting developing industries from international competitors, protectionism can also simply give those industries time to operate, which gives personnel time to gain mastery over certain procedures. In this way, countries can turn comparative disadvantages into comparative advantages.

PROBLEM! Not every industry which gets chosen for protection will ultimately grow up to be an international "winner", so each time the government placed an industry under protection, they are effectively gambling (as protectionism exacts economic costs) on their choice. If governments do this frequently, statistically, they are likely to choose more losers than winners, which would be quite costly.

=(

4: Protectionism can allow certain key industries to earn economic profits and thus innovate more. As such, Canada has strategic trade policy in place with regards to Bombardier (if you remember, they're the company which made the olympic torches)

OTHER REASONS

1: There are advantages from diversification. Countries which are only specialized in a narrow range of products may use protectionism in order to diversify their economies (which gives local firms a "safe space" to expand into new industries, thus increasing the range of products produced domestically). This can be useful in that it buffers the volatility and risk posed by price changes and new technologies by spreading production to several different sectors. The idea here is not to "put all of your eggs in one basket" (although, often, this is more of a political argument than an economic argument)

2: Protectionism lets governments protect favored groups! In Canada, competitive advantage favors skilled labour over unskilled labour, and as a result, free trade may lower the wages of unskilled laborers (who are now competing with wage slaves from overseas). Here, protectionism can redistribute income to certain productive groups, but at the expense of the collective standard of GDP. There is a deadweight loss!

USUALLY, HOWEVER, PROTECTIONISM IS FOR POLITICAL OR FALLACIOUS ECONOMIC REASONS!!!!!!!!! >=(

HERE ARE SOME FAULTY ARGUMENTS WHICH PEOPLE WILL OFTEN POSE IN ORDER TO SUPPORT PROTECTIONISM!

1: "We've got to keep our money at home"
The Premise: If I buy a domestic good, by country will have both the good AND the money used to buy that good
Why it's incorrect: Domestic money is only useful for buying domestic goods. If you are buying foreign products, the money you spend on those products eventually gets used to buy Canadian products- it flows between the two trading countries

2: "We've got to protect ourselves from low-cost foreign labour"
The Premise: Low wage foreign goods will eliminate domestic goods from the market, and thus lower the domestic standard of living.
Why it's incorrect: This goes against the law of comparative advantage. Even if a foreign country can produce all goods at a lower cost than Canada, it would still be advantageous to trade, as trade will lower the opportunity cost of having certain products.

3: "Exports are good, and imports are bad"
The Premise: Exports add to domestic GDP, while imports take away from domestic GDP
Why it's incorrect: Standard of living is dependent on consumption, not production. If a country exports a lot of goods, but derives its comparative advantage by paying its workers very low salaries, then those workers will not be able to consume very many products, on average, and thus that country's standard of living will probably be quite low.

4: "Protectionism creates local jobs"
The Premise: Protecting the domestic market can help save local jobs, and thus combat unemployment
Why it's incorrect: Protectionism reduces employment in other sectors which may have local comparative advantages, and thus, while it may increase employment in one sector, the overall economic effect is inefficient.

-----------------

METHODS OF PROTECTIONISM

TARIFFS: Import Duties- these are a tax on imports. They increase costs for domestic consumers, but benefit domestic producers (who can sell at higher than the world price) and the government (who receives tax revenue). Tariffs create a deadweight social loss for the economy as a whole.


Originally, at the world price, Canada will import 1500 units of this product, and domestic producers will supply the other 500 units needed to satisfy demand.

Once the tariff raises the prices, Canada only imports 500 units of the product, and domestic producers supply the other 1000 units needed to satisfy domestic demand (as you can see, demand has decreased due to the higher price).

Consumer lose surplus represented by sections C, D, E, & F due to the Tariff
Producers gain surplus represented by section C due to the Tariff (the increase in price times the increase in production, minus the costs incurred by increasing production)
The government gains section E due to the Tariff (the quantity of foreign imports at the Tariff price, multiplied by the amount of the Tariff)

SECTIONS D & F REPRESENT A DEADWEIGHT SOCIAL LOSS, HOWEVER! (tragic, isn't it!?)

--------------------------------

QUOTAS AND VOLUNTARY EXPORT RESTRICTIONS (VERs)
An import quota is like a quantity ceiling- it restricts the quantity of products which a country will import
With a voluntary export restriction, the exporter agrees to limit the amount of exports it will send to any one country.
This incurs costs for domestic consumers, but benefits domestic producers
The net result is a deadweight social loss which is greater than that which results from a Tariff!


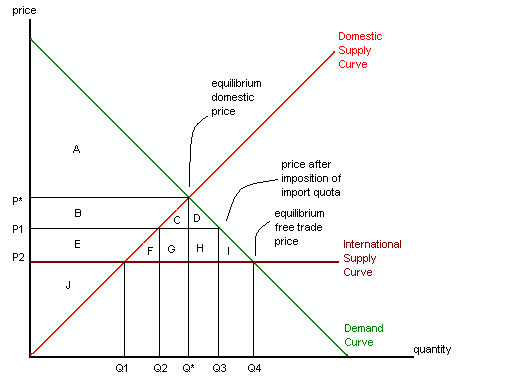
At the world price, Canada will import Q4 - Q1, and domestic producers will supply Q1
Let's say that a quota restricts domestic imports to Q3 - Q2. If this happens, then the domestic price must rise to P1, where the quota exactly satisfies the excess demand which domestic producers cannot meet.

Consumers lose surplus equal to E, F, G, H, & I due to the quota,
Producers gain surplus equal to E due to the quota
Since there is no taxation here, the higher price on the quota goods causes foreign producers to gain surplus equal to G & H

THERE IS A DEADWEIGHT LOSS EQUAL TO SECTIONS F & I due to the quota! >=(

Usually, in trade barrier situations, exporters prefer a quota (so they can gain the extra revenue section) while importing governments prefer a tariff (so they can gain the extra revenue section).

----------------------------------------

NON-TARIFF BARRIERS

1: Antidumping Duties
-Dumping is the practice of selling a good in a foreign country at a price below domestic prices at a reason other than costs
-This is like price discrimination (remember from micro) but on an international level
-Usually, it is only temporary, in order to sell off excess supply, or to weaken local industries and force reliance on foreign imports
-It is seen as anti-competitive, and many people believe that it is an unfair form of competition
-Antidumping duties (taxes to bring "dumped" imports back up to the domestic price level) are often used to compensate for this
-Recently, however, these have been abused and used as a non-trade barrier
-When Antidumping Duties are used, the domestic price becomes the price floor, regardless of the foreign price (which can lead to an inflexibility in domestic prices compared to the world price)
-As such, if the world price falls below the average costs for domestic producers, they are protected
-Often, the system requires foreign accusers to prove that dumping is occurring in order for antidumping duties to be instated

2: Countervailing duties: a tariff imposed as a trade remedy to counteract foreign governments subsidizing their industries
-Governments wishing to impose countervailing duties must prove that there is a foreign subsidy being used to bolster a certain foreign industry, and that it is significantly harming the prospects of domestic producers
-The U.S. is currently placing countervailing duties on Canadian softwood lumber.

-----------------------

IMPORTANT ORGANIZATIONS AND TERMS

GATT- The general agreement on trades and tariffs: an effort to reduce international protectionism

The Uruguay Round- reduced tariffs by 40%, but failed to deal with European and Canadian agricultural subsidies (eventually, they ended quotas, but replaced them with Tariffs in a process called Tariffication)

WTO- World trade organization- it has 148 members, it is a global organization which deals with the rules of trade, and it endeavors to lower trade and non-trade barriers. It also includes a formal dispute settlement mechanism

Doha Round- tried to reduce agricultural subsidies

The Battle for Seattle- People protested that human, labour, and environmental rights were not being addressed by the WTO. Interestingly, 3rd world countries often argue against considering these in trade deals

MAI- Multilateral agreement on investment: similar to WTO, but for investments

Free trade Area- Goods and services may move freely among member countries, but each member nation still sets barriers against foreign imports on an individual basis (like NAFTA) PROBLEM: Certain Tariffs have grandfather clauses, and thus persist despite agreements.

Customs Union- A free trade area, but with a common set of barriers against foreign imports (like Mercosur: Brazil, Uruguay, Paraguay, and Argentina)

Common Market- A customs union in which factors of production (i.e., workers) may move freely among member nations (like the EU)

THAT'S ALMOST ALL!!!

Saturday, April 17, 2010

Gains from International Trade

OKAY! Let's talk turkey about international trade.


Over time, while world GDP had been increasing at a fairly constant rate, world trade has increased exponentially!

Canada is, itself, involved in quite a bit of international trade (we export and import quite a lot of goods)

David Rciardo was an economist of lore (1772-1823), and he was a major proponent of international trade. He wrote "Current comparative advantage is a major determinant of trade under free-market conditions."

Economists who advocated world trade often promoted teachings which led to real changes, such as England repealing its corn laws and moving towards a more open economy (an open economy is one which engages in international free trade, and realizes certain advantages from this, known as the gains from trade).

GAINS FROM TRADE: These are increases in total economic output due to efficiency advantages resulting from local economies engaging in specialization and trade of goods in which they have a comparative advantage.

COMPARATIVE ADVANTAGE: A situation where one local economy can produce a certain good at a lower opportunity cost than other economies (i.e., if it is less expensive for Canada to grow wheat than it is for Haiti to grow wheat, then we would state that Canada has a comparative advantage in wheat)

WHAT IS THE LOGIC BEHIND INTERNATIONAL TRADE? It's the same logic which states that interpersonal trade will be beneficial!
-When there is no trade on an interpersonal level, each individual has to be self-sufficient: they must provide for all of their own needs
-Trade allows individuals to specialize in providing goods and services which they can produce or provide efficiently, and then trade those for goods and services which they are less proficient at providing.

For an example, if I am a Doctor, I could be very very good at fixing coronary blockages, but terrible at fixing pipes. Trade means that I can simply make money by acting as a doctor, and then trade this money to "borrow" a trained plumber, thus saving me hours of frustration and reading complicated instructions. In this situation, both me and the plumber are providing the services which we are most efficient in, and because I don't have to waste time learning how to fix pipe and he doesn't have to waste time memorizing human anatomy, the overall economic output between the two of us is higher! We are more efficient when we can divide and conquer! =D

Well... interregional and international trade follows the same logic!

There are two different sources of gains from international trade:

1- The fact that different local economies have different resource endowments (and therefore can benefit from specializing in producing products which fit well with regional endowments, both natural and acquired)

2- The fact that international trade leads to a larger market for products means that local firms can realize reductions in production costs due to increased production (they are able to achieve economies of scale)

---------------------------------

ABSOLUTE ADVANTAGE: This is when one country (or economy), compared to another, can produce more of a good from the same inputs

So, lets say that given the same inputs...

Canada can produce 10 bushels of wheat or 6 lengths of cloth
England can produce 5 bushels of wheat or 10 lengths of cloth

Canada has an absolute advantage over England in terms of wheat, and England has an absolute advantage of Canada in terms of cloth. Here, we have a situation of reciprocal advantage (each country is more adept at producing a different good), and thus it will be advantageous for England and Canada to trade!

WHY?!

Because each unit of input which Canada switched from cloth production to wheat production leads to 6 fewer cloths, but 10 more wheat. Similarly, each unit of input which England switched from wheat production to cloth production leads to 5 fewer wheat and 10 more cloth. The net effect of this is that the world production of both wheat and cloth has increased if both the countries specialize in what they are best at producing: there are worldwide gains from specialization.

But English and Canadian consumers want to purchase both goods... so unless these countries are able to trade, this specialization would not be practical.

----------------------------

THE LAW OF COMPARATIVE ADVANTAGE

Lets say that using one unit of input...

Canada can produce 100 bushels of wheat or 60 lengths of cloth
England can produce 5 units of wheat or 10 length of cloth

Here, Canada has can absolute advantage in both wheat and cloth (so Canada is more efficient at producing either of these products). Some people might think that Canada should thus not engage in trade... but they would be WRONG! Dead WRONG!

Canada can produce 20 times as much wheat at England, but only 6 times as much cloth using one unit of input. From this, we can surmise that Canada has a COMPARATIVE ADVANTAGE in wheat, while England has a comparative advantage in cloth.

Each country should trade goods in which it has a comparative advantage. Trade, in this case, increases the world's per-capita GDP. Comparative advantage is a necessary and sufficient condition for trade. Absolute advantages (in the absence of comparative advantages) do no lead to gains from trade.

How do we figure out which product a country has a comparative advantage in?

Easy! You just calculate the opportunity cost of producing any one good. Given the previous example, the OC of producing 100 bushels of wheat in Canada is 60 lengths of cloth, so the opportunity cost of each bushel of wheat is 0.6 lengths of cloth. Similarly, the OC of producing is length of cloth is 1.67 bushels of wheat for Canada. The opportunity cost for England of producing 1 length of cloth is 0.50 bushels of wheat, and the opportunity cost for England of producing 1 bushel of wheat is 2 lengths of cloth!

The opportunity cost of wheat is lower in Canada than in England, so Canada has a comparative advantage in wheat
The opportunity cost of cloth is lower in England than in Canada, so England has a comparative advantage in cloth

The point: opportunity cost depends on relative costs, no absolute costs!

WHENEVER OPPORTUNITY COSTS DIFFER, SPECIALIZATION AND TRADE CAN INCREASE THE WORLD PRODUCTION OF BOTH COMMODITIES, WHICH LEADS TO INCREASED CONSUMPTION POSSIBILITIES

*to note: increased production does not necessarily lead to increased consumption, and standard of living depends on consumption rather than production (so a country could produce a whole lot of products, but if its workers make very low factor incomes, and are hence unable to consume many goods, that country's standard of living may still be extremely low.)

ABSOLUTE ADVANTAGE DOES NOT LEAD TO GAINS FROM TRADE!

If Canada can produce 100 wheats or 60 cloths given one unit of input
and England can produce 10 wheats or 6 cloths given one unit of input

Canada has the same absolute advantage of England in terms of both products, but each country has the same opportunity costs in terms of producing each good. Because of this, specialization and trade will NOT lead to any gains for either country, nor will it increase world output of either product.

There are other reasons in addition to comparative advantage that can make it beneficial to engage in specialization and trade

Basically, whenever OC's differ for the same products between different countries, specialization (and subsequent trade) leads to an increase in net production of goods, and as a result, a decrease in costs, because of...

1: Economies of Scale- Trade creates a larger market for domestic producers (who, after international trade, provide products for consumers around the world instead of just domestically)

2: Product Differentiation- A large international market for any type of product leads to further specialization, or product differentiation. For an example, in Europe, each country specializes in intra-industry trade. Between Canada and the U.S., each country specializes in a different type of car.

3: Learning by doing- Larger international markets lead to specialization, which leads to "accumulated experience". For an example, the silicon valley area of the United States has gained a reputation for computerized innovation, and as a result of that specialization, people from that area gain experience over time, and become better-equiped to compete in that industry.

Economies of Scale = Production moves to the bottom of the LRAC
Learning by Doing = The entire LRAC shifts downward, so any level of production costs less

-------------------------------------

SOURCES OF COMPARATIVE ADVANTAGE:

1: Natural Factor Endowments
-This is how traditional economists explained comparative advantages
-What each country is "born with"
-This includes both natural resources and climates, as well as social patterns and institutional set-ups
-This natural resource advantage translates into cost advantages (i.e., a very fertile country will not incur as many costs growing food as an arid country)

2: Acquired Comparative Advantages
-This is a newer idea: what each country DEVELOPS can lead to a comparative advantage in certain products
-For an example, social fixtures such as education, healthcare, and social services can create more productive workers
-Research and development can also lead to innovations and localized experience which gives certain nations comparative advantages in certain sectors (like Canada and aerospace engineering, or Korea and shipbuilding)

-------------------------

PATTERNS OF INTERNATIONAL TRADE:

We know that countries should specialize and then trade in goods in which they have a comparative advantage.

So... do countries actually export those goods in which they have a comparative advantage? The answer is YESSSSSSS!

THE LAW OF ONE WORLD PRICE: Internationally traded goods sell at the same price, regardless of which country they are sold in, assuming
-zero transport costs
-it is actually the same good
-competitive markets
-the good is tradable

World price simply equates global supply and demand for any product to determine the equilibrium price

So.........

If one country has a comparative advantage in a certain product which would potentially lead to a lower domestic price for this product than the world price level, instead of simply selling the product at the domestic price level, that country will sell that product on the world market at the (higher) world price level: the domestic excess supply will get sold off on the international market.

THE THEORY OF COMPARATIVE ADVANTAGE IS STILL RELEVANT~!! Sources of those competitive advantages may have changed over the years, but the basic premise of this theory still holds true!

------------------------------------

TERMS OF TRADE: These determine how the gains from trade are shared- in other words, how will the gains in world per-capita GDP be shared among the trading nations.

The Terms of Trade = the ratio of (the price of exports / the price of imports)
OR
The relative international price of imports (how many imports can be purchased per unit of export)

If the terms of trade increase, this is favorable for the nation in question, because they are able to get more imports per export. The reverse is true if the terms of trade decrease.

Unfavorable terms of trade will not be conducive to trade! Basically, if the terms of trade make it so that the OC of obtaining imports is equal to or greater than the OC of producing a product domestically, the country in question will not trade for that product! There needs to be a win-win situation (terms of trade which allow for both countries to enjoy lowered OCs) in order to trade to occur.

-----------------------

International Trade and the PPC:


When there is trade, consumption can differ from production! This means that trade can facilitate changes in production which allow for patterns of consumption which lie outside the PPC!

The slope of the dotted line = the terms of trade (tt)

Basically, given any point on the original PPC, international trade allows that country to trade products with another country at a rate which differs from that given on the PPC (which is usually convex). As you can see, if the country in the diagram specializes and trades, it can reach point B!

By specializing (changing production), countries can optimize their production in order to best take advantage of good terms of trade!

NOTE: Which country wins depends on the terms of trade (the slope of the line). Also, the consumption pattern (the point on the CPC) which each country settles into will depend on their preferences between the two products being compared.
Also, most countries have increasing OCs with increased specialization, and thus they have convex PPCs


That's all for now!

Saturday, March 27, 2010

More Irritating Details About Inflation

The Phillips Curve & Accelerating Inflation

-We know what the Phillips curve is. I'm not explaining it again.
-At Y* and U*, there is no gap inflation
-When the economy is in an inflationary gap, the BoC must validate for wage inflation
-In the 1960s, the level of wage and price adjustment began to rise for any level of output (the whole phillips curve shifted to the right)
-Why? Because the original phillips curve included only gap inflation and ignored expectation inflation (which impacts wage changes, obviously)
-This newly-shifted phillips curve is called the expectations-augmented phillips curve. There is still an inverse relation between the unemployment rate and the rate of changes of nominal wages, but with the effect of expectation inflation built into the model.
-Expectation inflation is graphically represented by the height of the phillips curve above the X axis at U*

Using this new phillips curve, we can see than when there is gap inflation, and when there are expectations adding to inflation, the curve shifts up at Y*: expected inflation increases for all levels of inflation, and thus, inflation can accelerate.

THERE IS NOT A STABLE TRADEOFF BETWEEN INFLATION AND OUTPUT. TO MAINTAIN Y @ LEVELS GREATER THAN Y*, INFLATION MUST ACCELERATE.

------------------------------------

Is inflation a monetary phenomenon? Was Milton Friedman correct when he said "Inflation is everywhere, and always a monetary problem"?

Does inflation have purely monetary consequences? What about its consequences- are they purely monetary?

Well... inflation on its own can be caused by either an increase in AD or a decrease in A. However, unless monetary validation is continuous, inflation will only be temporary. As such inflation is not necessarily caused by monetary issues, but continuous inflation IS.

The consequences of inflation:
1: Short run gap inflation caused by output being higher than Y*
2: Short run supply inflation caused by Y being less than Y*
3: In the long run, output will always eventually return to Y*, so inflation will only cause a change in the price level.

so... SUSTAINED inflation is everywhere, and is always a monetary problem.

---------------------------------------------

REDUCING INFLATION: The process of disinflation

Accelerating Inflation is inflation. There is a positive change in the price level.
Constant Inflation is inflation. There is a positive change in the price level.
Decelerating Inflation is disinflation. There is a positive change in the price level, but at a decreasing rate.
Stopped Inflation is zero inflation. There is no change in the price level.
Reverse Inflation is deflation. There is a negative change in the price level.

How do we reduce constant inflation from occurring at Y*??? by STOPPING EXPECTATIONS
How do we reduce accelerating inflation? By NO LONGER VALIDATING CHANGES IN THE ECONOMY

both of these measures may cause short-term economic pain (recessionary gaps cause unemployment, which is both depressing for individuals, and unproductive for economies in general). However, this will eliminate sustained accelerating inflation.

But is this a good thing?

There is often questions over whether the benefits of reducing inflation outweigh the costs.

How it works:
1: remove monetary validation to eliminate the inflationary gap (which allow the SRAS to return GDP to Y*)
2: stagflation: the SRAS decreases to the point where it actually overshoots Y* due to the intensity of wage momentum. As a result, there will be a period of rising unemployment accompanied by inflation
3: recovery: wage adjustments can bring SRAS back to Y* the slow way, or the BoC can use expansionary monetary policy to bring it there faster (at the cost in inflation)

The cost of disinflation:
-Disinflation is caused by a recessionary gap
-The cost of disinflation is equal to the loss of output caused by the required recessionary gap.

The SACRIFICE RATIO is the cumulative loss of output as a percentage of potential output divided by the percentage reduction in the inflation rate.

------------------------------------

THE COSTS OF INFLATION: Why is this bad, again?

1: Unanticipated Inflation
-Affected the distribution of income (redistributes income from creditors to debtors)
-Wage contracts: redistributes income from employers to employees if inflation is less than expected, and vice versa if inflation is higher than expected
-Pension contracts: redistributes income away from pensioners (although this can be solved by indexing pensions for inflation)

1970s: Trudeau indexed public pensions, and they have remained indexed as thus until..
1980s: Mulroney de-indexed tax brackets
2000: Chretian fully indexed tax brackets

Low versus Moderate Inflation: BC advocates low inflation
-The price signal distortion hypothesis suggests that inflation interferes with the information conveyed by price changes. As a result, market participants can have a difficult time distinguishing absolute prices from relative prices. This extra confusions created by inflation reduces market efficiency
-In PLANNING DISRUPTION, inflation interferes with retirement plans and long term contracts

With moderate inflation...
-The downward nominal wage rigidity hypothesis claims that low levels if inflation reduce economic efficiency, because real wage cuts will require nominal wage cuts, which will be resisted. Basically, if inflation is zero, a 2% cut in real wages required a 2% cut in nominal wages: workers will resist a drop in their nominal wages. However, if inflation were high enough, nominal wages could simply be maintained to the effect of reducing real wages, and this is met with much less resistance. In this way, this theory suggests that high inflation facilitates more efficient economies, because it makes it easier for employers to "trick" their employees into accepting real wage cuts.

The zero bound on nominal interest rates hypothesis claims that the BoC cannot run expansionary money policy.

AS A GENERAL RULE, healthy economies have moderate inflation (this is caused naturally by economic growth and increases in aggregate demand).

High and accelerating inflation leads to prediction problems, and arbitrary redistribution of income. It may also lead to hyperinflation. Politics, however, is usually the entity to blame for these problems.

HYPERINFLATION: This is associated with low economic growth. Why? Because hyperinflation increases transaction costs (ie: menus must be changed constantly, and holding money for transactions is risky, because that money's purchasing power can rapidly decrease)

DISINFLATION: Governments can try to use wage or price controls, but usually this doesn't work.
-Two recessions in Canada have been caused by the government of Canada attempting to slow the rate of disinflation. As such, the costs of disinflation probably outweigh the benefits unless inflation is getting seriously out of control.

DEFLATION: Like disinflation, is not a good idea.

THAT'S ALL

Wednesday, March 17, 2010

Monetary Policy in Canada

This is the last piece of the puzzle! This chapter is all about how the government of Canada uses policy instruments to change the money supply!

The central bank can set the money supply and let the market determine the interest rate

OR

The central bank can set the interest rate and the money supply will adjust to this interest rate

PROBLEMS WITH ADJUSTING THE MONEY SUPPLY DIRECTLY:
-The Bank of Canada (BoC) cannot directly control the money supply through the currency ratio and the reserve ratio (they can't control minds and make banks hold more or less assets and make people hold more or less money)
-Also, it's sometimes confusing as to which definition of the money supply should be used: H? M1? M2? Know know...

SO, the BoC sets the interest rate instead, and then accommodates for fluctuations and changes by using open market operations. (The US directly changes the money supply by printing more or less money, while Canada simply changes the bank rate)

There are 5 Different Policy Instruments The BoC Uses:
1: The Overnight Target Rate (Which is changes by changing the Bank Rate)
2: Buyback Operations (Specials and Reverses)
3: Shifting Government of Canada Accounts
4: Moral Suasion
5: The Announcement Effect

NOTE** It's important to know the difference between operational targets: usually, governments can only target one factor, so they have to choose between targeting

a) The Exchange Rate (from 1962-1970, Canada targeted the exchange rate and tried to keep its external value at 92.5)
b) The Interest Rate/Money Supply (from 1975-1982, the BoC would adjust interest rates to affect the money supply through the liquidity preference system. The problem was that interest rates became extremely volatile, and the government had no way of controlling the price level)
c) The Inflation Rate (the BoC uses interest rates and money supply as a policy instrument to affect the inflation rate, so the operational target is currently PRICES. The BoC tries to keep inflation at about 2%, because a little bit of inflation is healthy

Policy Variables: These are the ultimate targets for policy changes
Y - stable economic growth
U - low unemployment
P - Low Inflation !!! THIS IS THE PRESENT GOAL OF THE BoC

----------------------------------

THE 5 POLICY INSTRUMENTS

1: THE OVERNIGHT RATE

Note* the interest rates on borrowing increase as the term of the loan grows longer (as a compensation for leaving money inaccessible for a longer amount of time)

The Overnight Rate: This is the daily interest rate which chartered banks charge each other for borrowing money (or that investment dealers charge to banks for borrowing money) in cases where they have insufficient funds to clear cheques. These loans have a very short maturity (the term is extremely short) and the interest rates are MARKET DRIVEN

The BoC is the LENDER OF LAST RESORT

The Bank Rate is the rate which the BoC charges to lend to money to chartered banks. This is the upper limit of the overnight rate. Because the bank rate is so high, most chartered banks will not borrow from the bank of Canada unless all other sources refuse to loan them money

The Overnight Rate Operational Band: This is the difference between the highest overnight rate (the bank rate) and the lowest overnight rate (the rate the BoC pays to borrow for depoits)
-It is measured in basis points (each basis point is worth 0.01%, so an operational band of 50 basis points would mean a difference of 0.5% between the highest and lowest overnight rates)

Overnight Rate Target: the midpoint of the operational band for overnight rates, as set by the BoC
-THIS is the policy instrument used by the BoC to affect the interest rate
-There are fixed announcement dates: the BoC announces the overnight rate target 8 times per year

The USA uses a slightly different system...


OKAY: so basically, the bank rate is FIXED by the BoC
-Money's liquidity (the demand for money) is given
-The BoC accommodates the money supply to ensure equilibrium in the money market
-The money supply is thus endogenous, and becomes determined from the interest rates and the demand for money!

1: BoC increases the overnight rate (i goes up)
2: Banks increase their target reserves to buffer against this higher opportunity cost of borrowing from the BoC
3: The money supply decreases (because the reserve ratio is higher)
4: The market interest rate goes up!

This is a long-about way of showing how the market interest rate (which includes the prime rate, the 5-year mortgage rate, and commercial lines of credit) is related to the overnight interest rate!

NOTE* A change in the overnight rate target and other market interest rates usually happens very quickly BUT the demand for loans changes gradually (so the first step of the overall transmission mechanism is much faster than then subsequent steps)

As the demand for money changes, the BoC accommodates by using open market operations!

2: BUYBACK OPERATIONS (INCLUDING OPEN MARKET OPERATIONS)
-The BoC Uses Specials and Reverses to stabilize the overnight rate inside the operational band
-Buyback operations are used to fine-tune the overnight rate target within one basis point of the target

SPECIALS (Specials purchase and resale agreement):
-This is a transaction in which the BoC offers to purchase government of Canada securities from major financial players with an agreement to sell them back at a predetermined price the next business day
-This allows the BoC to put money into the system for one day
-This OFFSETS UPWARD PRESSURES on the overnight rate (by adding a bit to the money supply, the BoC decreases the interest rate a little bit)
-The BoC initiates SPRAs daily if overnight funds are generally trading above the target rate
-Differences between the purchase and the sale price determines the overnight rate

REVERSES (Sale and repurchase agreement)
-This is a transaction in which the BoC offers to SELL government securities to major financial parties with an agreement to buy them back at predetermined prices the next business day (this sale is called a reverse)
-Basically, this let's the BoC take cash out of the system for a day (by coaxing investors to temporarily store wealth in bonds instead of money)
-Reverses are used to offset downward pressures on the overnight rate
-The BoC initiates reverses daily if overnight funds are generally trading below the target rate

OPEN MARKET OPERATIONS (OMO): LONG RUN MONETARY ACCOMMODATION
-An OMO is the purchase/sale of government securities by the BoC in the open market for long run monetary accommodation
-Government securities are long run loans to the government
-Treasury bills are short term loans to the government
-These are auctioned off every Thursday, just like stocks, in a market

The BoC BUYS securities to increase excess reserves and attempt to increase the money supply
The BoC SELLS securities to decrease excess reserves and attempt to decrease the money supply

This analysis assumes that there are no cash drains, and that the reserve ratio remains constant in the long run (neither of which may be true)

3: SHIFTING GOVERNMENT OF CANADA DEPOSITS

Cash Management: The Bank of Canada shifts Government of Canada deposits to and from the Bank of Canada and the chartered banks. This is the major day-to-day instrument which the BoC uses to reinforce overnight rate targets within the operational band

Transferring money to a chartered bank increases their reserves, which allows the chartered bank to safely lend out more money, thus increasing the money supply
Transferring money from a chartered bank back to the BoC decreases chartered banks' reserves, which forces the chartered bank to lend out a smaller proportion of money, thus decreasing the money supply

4: MORAL SUASION

-The BoC enlists the cooperation of commercial banks
-This is possible because there is such a small number of banks in Canada
-Since there are not required reserves in Canada (required reserves are not legislated), this tool is more important
-For an example, the BoC may require an increase in settlement balances held at the BoC

5: THE ANNOUNCEMENT EFFECT

-There are fixed announcement dates where the BoC announces the bank rate (8 times per year)
-Like moral suasion, an increase in the bank rate sends a signal to the economy of the government's intentions, which can affect private investment (due to changed expectations)

CONCLUSION: The BoC fixes the overnight rate target, then uses buyback operations and shifting to reinforce it and open market operation to accommodate the demand for money in the long run

1: Policy instruments: The BoC sets the bank rate
2: The Money Market which defines reserves determines the money supply and the equilibrium interest rate
3: Transmission to real sector through the investment and net export effects

GAPBUSTING GUIDE

TO FIX A RECESSIONARY GAP (CREATE EASY MONEY)
-Decrease the target rate
-Increase the money supply
-Decrease interest rates
-Increase Investment and net exports
-Increase Aggregate Demand
-Y moves to the right, back to Y*

TO FIX AN INFLATIONARY GAP (TIGHTEN MONEY)
-Increase the target rate
-Decrease the money supply
-Increase interest
-Decrease investment and net exports
-Decrease aggregate demand
-Y moves left to Y*

The Transmission Mechanism


So... what happens when the money supply changes? How does this affect things? That's what we're going to figure out today!

Remember the marginal efficiency of investment function?

There are two reasons why interest rates and desire for investment are negatively related
-lower interest rates mean that there is a lower opportunity cost for investing (it costs less to borrow money)
-when interest rates are lower, investing in capital becomes more attractive than keeping money in bonds (so if buying a new mixmaster will have a 4% yield, my friend the baker is much more likely to buy one when an equivalently-priced bond would only give him a 2% yield)
-Investment is determined by the REAL interest rate: for simplicity's sake, just assume that there is no inflation in this model for now

SO: There is an investment transmission mechanism

Let's do this in steps

1: The government changes the money supply (we'll learn how in the next little while)
2: The change in the money supply, thanks to the way the money market works, causes interest rates to fall (this is liquidity preference theory)
3: Lower interest rates cause investment to increase (this is marginal efficiency of investment theory)
4: Increased investment causes the family of aggregate expenditure curves for this economy to shift up
5: A shift up in aggregate expenditure causes aggregate demand to shift to the right, indicating an increasing in GDP, a decrease in unemployment, and an increase in the price level

BE SURE THAT YOU CAN REPRESENT EACH OF THESE STEPS GRAPHICALLY! If you have any questions about that, just send me an email and I will spell it out for you! =D

------------------------------

THERE IS ALSO AN EXCHANGE RATE TRANSMISSION EFFECT:

In open economies, consumers are not restricted to buying domestic bonds- they can also buy bonds sold by foreign governments. Thus, when the interest rate falls for one country in comparison with other countries, this makes that particular country's bonds less attractive for investors (if China's interest rate is 25% and Canada's is 4%, why the hell would you put your money in Canadian bonds [assuming the Chinese bonds were relative risk-free]). As a result, when domestic interest rates fall, investors tend to pull money OUT of the domestic economy and into foreign economies. This DEVALUES domestic currencies.

We know that when domestic currencies are devalued, this makes it more attractive for foreign economies to import domestic goods, and less attractive for local consumers to import foreign goods (for price-related reasons). Thus, net exports increases. This leads to an increase in aggregate expenditure, and subsequently, an rightward shift in the aggregate demand curve!

SO! There are 2 different pathways through which changes in the money supply can affect aggregate demand in an economy (and by association, Y, U, and P)

-----------------------

THE LONG RUN NEUTRALITY OF MONEY

Classical economists divided the economy into real and monetary sectors: they believed that changes in the money supply only affected the price level, but would not impact GDP in the long run
MV = PY where V and Y are constant (money has a constant velocity, and GDP tends to return to its potential leve in the long run)

Modern economist now understand that in the short run, changes in the money supply CAN impact GDP through the monetary transmission mechanism. At the same time, they state that in the long run, the "anchor and chain" mechanism will bring GDP back to its potential level (through wage adjustment)

Pretend this graph indicated that the increase in AD was due to an increase in the money supply. In the long run, inflationary pressures cause wages to increase, which effectively raises costs for firms. This shifts aggregate supply to the left until the real GDP is back at Y*, but at a higher price level

Hysteresis: some economists debate that Y* can be affected by short run trends in Y, not just factors and productivity (for an example, a long-lasting recessionary gap may cause worker skills to depreciate, thus bringing productivity down, and consequently lowering potential GDP as well)

---------------------------

SOME OTHER COOL THINGS
-Changes in the money supply cause larger changes in the interest rate when the money-demand curve is STEEP
-Changes in the interest rate cause larger changes in investment when the MEI curve is very FLAT

MONETARISTS: believe that the LPF is steep and the MEI is flat- they think that monetary changes can cause LARGE changes in GDP and price levels
KEYNESIANS: believe that the LPF is very flat and that the MEI is very steep- they think that monetary changes are much less effective than fiscal changes in affecting GDP and the price level

That's all for now. Only one more bit to cover for the midterm! =D

Wednesday, February 17, 2010

GROWTH ACCOUNTING

It is generally believed that labour accounts for about 2/3 of all income generated, and that capital accounts for approximately 1/3 of national income

as such, percentage-growth in potential national income is = to the percentage change in the level of technology + 2/3 * the percentage change in labour + 1/3 * the percentage change in capital

MEASURING TECHNOLOGICAL CHANGE

-It is impossible to directly measure technological change. Solow tried, and got a Nobel Prize.

-The Solow growth model included only 3 independent varaibles: labour, capital, and "other"

-This "other" is the "Solow Residual" or "Total Factor Productivity" or "A" (in our model). It captures all growth in GDP which is not accounted for by changed in N (L and H) and K.

-BIG PROBLEM HERE: Solow's model included both the quantity and quality of labour and capital, and a great deal of technological change is EMBODIED with labour or capital (so technology factors into labour or capital, and cannot always be separated them from). For instance, if one of my shitty sweat-shop sewing machines breaks down and I decide to replace it with an uber-fast, ultra-modern sewing machine, the capital stock will remain the same for my sweatshop, but the technology level has increased.

-As such, the Solow residual underestimates true technical change (as it can only include disembodied technological changes)

--------------------------

The Cobb-Douglas Aggregate Production Function is an example of an aggregate production function with 2 characteristics
-The law of diminishing marginal utility
-Constant returns to scale

For this APF, Y = A * N(2/3) * K(1/3)

Here, equal growth rates in labour and capital cause total GDP to grow at the same rate (as it would in a steady state)

y = A * k(1/3)

This is the per-capita APF, where y is per-capita GDP, and k is the capital-labour ratio
Equal growth rates in both labour and capital (ie: a constant k) cause y (per capita GDP) to remain constant

SO: BIG QUESTION: HOW DO WE ALLOW FOR GROWTH?

1: Increase savings (let per capita savings become larger)- in order for growth to occur, the economy requires sufficient savings to increase the capital stock faster than the population growth.

If you are in the Robert Gateman club of not-breeding, choosing NOT to personally contribute to population growth can also help economies grow here...

2: Increase technology: This requires infrastructural developments (health, education, law, physiological needs such as food and water taken care of), and many such developments are difficult for developing nations to set up.

WHY IS TECHNOLOGICAL CHANGE IMPORTANT?

Technological improvements lead to increased productivity, which increases the potential per-capita GDP

Embodied Technical Change = technical change intrinsic to the particular human or unit of physical capital in use: it is a change in the quality of the input (so a higher education, or a computer upgrade would both be examples of embodied technical changes)

Disembodied Technical Change = technical change that is NOT intrinsic to human or physical capital in use. This is a change other than to the quality of the capital (so if my sweat-shop fore-woman comes up with a fantastic new sewing procedure which halves the time it takes her to sew a sneakers, and then she teaches all of her sweat-shop buddies how to sew like this, that new technique would be an example of a disembodied technical change)

Usually, disembodied changes eventually become embodied, so the distinction becomes less important over the long run.

CONVERGENCE HYPOTHESIS: This an interesting theory, and there are 2 different facets of it

1: Absolute Convergence: the tendency for GDP AND Growth Rates in GDP to be equal across nations: each nation will have the same steady state values for y* and k*
-This assumes that different countries have the same marginal propensity to save, the same rate of population growth, and the same rate of technological improvement
-This theory states that if two countries have the same growth model, then even if one starts farther to the left, they will both end up with the same standard of living

2: Conditional Convergence: the tendency for Growth Rates in GDP to be equal across nations: each nation will have the same steady state values.
-This theory assumes different marginal propensities to save for different nations, different population growth rates, and different technological growth rates
-This theory acknowledges that different countries will have different per-capita GDP, but states that they will have THE SAME GROWTH RATES!

-------------------------------------------------

NEW GROWTH MODELS

The Neoclassical Growth Model made growth dependent on exogenous variables such as population growth, the savings rate, and the rate of technological change.

Some new growth theories alter the 2 assumptions of the Neoclassical Model:
-Instead of technology as exogenous, they state that technological changes can be explained within the economic model
-Instead of having diminishing marginal returns, some new growth models suggest that the marginal product of capital is constant, or that there is even increasing marginal product of capital over time!

-----------------------------------

ENDOGENOUS TECHNOLOGICAL CHANGE:
Endogenous growth is self-sustaining growth
In this theory, we assume constant marginal product of capital
For an example, if the price of an input rises, firms will develop a new technology rather than just switching to an existing alternative input (so market structures and competition can facilitate technological change)
-Some people believe that competition foster technological change: others believe, especially in the case of health technologies, that only monopolies can risk the large expenditure required to create new drugs

LEARNING BY DOING: In the 1940s, Shumpeter said that innovation was a one-way street- that research caused new developments, which led to new machines and new products. Today, things work different: it is more of a 2-way street. There is a feedback mechanism (ie: the Japanese method of building cars, where the mechanics and workers collaborate with the designer in order to streamline research and production in such a way that is productively efficient).

SHOCKS and INNOVATION:
-Different countries respond to economic shocks in different ways. Some will find different countries to produce goods in where costs are cheaper: others will change production methods and increase technology to make it more cost effective!

---------------------------------------

INCREASING MARGINAL RETURNS TO INVESTMENT: Here, each new addition to the capital stock is more productive than the last.

There are 2 sources of increasing marginal returns to investment:

Market-Development Fixed Costs (Paul Romer)
-The original investment into new knowledge or technology has a large fixed cost
-Adopting or adapting this new technology once it has already been established is cheaper
-Also, consumers, wait to use new technologies
-In this way, the costs decrease as more and more people adopt new technologies, so the returns to scale increase with increasing investment

Knowledge
-It is a public good, so it is not subject to the law of diminishing marginal returns
-New ideas are non-excludable and non-rivalrous (as much as copyright laws try to prevent people from accessing them)
-New ideas are pure public goods
-New ideas may not suffer diminishing marginal returns
-SOOOO, because ideas play such a big role in economics, and ideas are practically unlimited, economics doesn't have to the be DISMAL SCIENCE! Yay!

------------------------------------

LIMITS TO GROWTH

-1970s, the club of Rome published a book called "Limits to Growth"
-This book predicted that increased growth would eventually destroy the earth's resources...

Here is their usual anti-growth argument: growth will look like more of what we witness today: production of mostly useless, impractical consumer goods with a short lifespan, which end up in the landfills in a couple of years.

This could be countered with the argument that growth can still occur, but under that condition that instead of producer large quantities of shitty goods, we focus on producing higher-quality, cleaner, longer-lasting, more efficient products.
-Growth permits societies to protect the environment and help the poor (if you haven't noticed, environmental protection legislation is more a by-product of mature industrial economies, and less-so of developing nations)
-The thought is that market participants will react to supply shortages, and innovate around them (ie: by the time oil runs out, productive processes will have innovated away from it)

RESOURCE EXHAUSTION
-Limits to growth are based on fixed technology and resources
-BUT, technology leads to more efficient resource use
-AND technology leads to the discovery of new resources
-Problem: THERE ARE TOO MANY PEOPLE: More people on the earth means that we will require more resource expenditure

POLLUTION:
-Economic growth creates pollution. Nuff said

Although many economists believe that growth creates opportunities for humankind to combat resource depletion and pollution through increased technologies, a lot of these beliefs are based on blind faith.

Like... we are basically relying on our ability to innovate away from these problems...

but what if we simply can't do that? Then what..............?

The Neoclassical Growth Model and Steady States

THE NEOCLASSICAL GROWTH THEORY: This focuses on capital accumulation, and how it is affected by savings

One important function in the neoclassical growth theory is the AGGREGATE PRODUCTION FUNCTION. This function shows the relationship between total real output and total inputs (sort of like a "macro" version of the production function for individual firms we saw in microeconomics)

REMEMBER from the last leccture? There are three main determinants of economic growth: labour, capital, and technology. Well, with the aggregate production function, we say that output is technology times a function of labour and capital

Y = A x F(N,K) where A = total factor productivity (disembodied technology), N = Labour and Human Capital, and K = capital (both quantity and quality)

Now what happens if we divide through by N?

Well, we get

y = A x F(k) where y is the amount of GDP produced per worker, and k is the amount of physical capital available for each worker

Also, potential output is also representable here

Y* = A x F(Nfe, Kfc) where Nfe is full employment, and Kfc is full capacity. In other words, potential output is technology times a function of labour at its full employment level, and physical capital at its full- capacity level

Some important things to remember:
We assume in the long run that income is at its potential level (that there is no output gap)
L is labour quantity, H is labour quality, and N includes both the quality and quantity of labour.
K includes both the quality and quantity of physical capital
We omit land as a factor input for the sake of simplicity in this model
Technology includes entrepreneurship and savviness

PROPERTIES OF THE NEOCLASSICAL AGGREGATE PRODUCTION CURVE

1: In the short run, there are diminishing returns to scale: as more of a variable factor is added to a given amount of fixed factor, the additional output generated by the added factor (the "return") will get increasingly smaller and smaller: they will diminish... ceteris paribus (they will diminish if all other things are held constant) after a certain point (they will not begin to diminish immediately)
But, this is only true of the short run when one factor is increased, and all other factors are held constant!

2: In the long run, there are constant returns to scale: When all factors increase the same amount, output will also increase by that amount (so if I double the amount of workers and also the amount of sewing machines, my sweat shop should double its output of shitty sneakers!)

3: Technology is nuetral: A affects the productivity of K and N equally, so although technology is present, it will not disproportionately impact any one factor.

Image Plz! y = f(k)

4: Steady state equilibrium: Here, the per-capita capital (k) and the per capita output (y) remain constant over time, so /\y = /\k = 0

If the population is growing at n, then income and capital must also grow at the same rate in order to remain in a steady state equilibrium. In other words, in order to be in a stead state equilibrium, the percentage change in output must equal the percentage change in capital, which must = the percentage change in the workforce.

y* and k* are the steady state values (they don't change over time)

Investment required to provide capital for new workers and to replace machines that have worn out (depreciation) is just equal to the national savings in a steady state equilibrium, so New Capital + Replacement Capital = Investment = Savings

If savings is greater than investment, than capital per worker will increase, and thus output per worker will also increase

If savings is just equal to investment, then the capital per worker will be k* and thus output per worker will be y*

When savings is equal to required investment, the economy is in a steady state equilibrium, each worker will have access to k*, and will produce y*

MORE ON THE STEADY STATE

To maintain k at a constant rate, investment depends on both population growth and the depreciation rate. Some of investment will have to go to the new workers

WE ASSUME that the population growth rate is constant: thus, to keep capital per worker constant, you must grow capital by nk (the population growth rate times the amount of capital per worker)
WE ASSUME that the rate of depreciation is constant: thus to keep capital per worker constant, you must grow capital by dk as well (the depreciation rate times the amount of capital per worker)

The level of investment required to fund all of this capital growth to maintain a constant capital-worker ratio can be represented by
I = (n + d)k

THE SAVINGS FUNCTION
Here, we assume that we have a frugal economy (there is no government or international trade)
We also assume that the marginal propensity to save is constant
So:
S/N = sy = sf(k)
in other words, per capita savings are a function of per-capita output, which in turn, is a function of the labour-capital ratio

PUTTING IT ALL TOGETHER:
The net change in the capital-labour ratio is equal to the excess of actual savings over required investment
/\k = to per-capita savings - the capital-labour ratio multiplied by (the population growth rate + the rate of depreciation)

In a steady state, /\k = o, so per-capita savings must be equal to per-capita required investment
sy* = (n + d)k*

Image plz

If we graph the production function, the savings function, and the required investment function with money on the Y axis and the capital labour ratio on the X axis, the savings function and the required investment function will eventually intersect: this point is the steady state equilibrium, E
at E, actual investment is just equal to required investment
the capital-labour ratio k* and standard of living y* are constant
At capital labour ratios lower than k*, savings will be greater than required investment, so the capital labour ratio and the standard of living will both increase.

Supply and Demand-Side Economics

Long-run aggregate supply, however, can shift if the potential national income shifts. When potential national income increases, this brings the equilibrium price level down, and the equilibrium level of GDP up in the long run. Neoclassical economists believe that policies which intend to bring real economic growth and betterment should focus on shifting potential national income to the right (increasing it): they believe that policies which only focus on increasing aggregate demand merely cause price-inflation in the long run.

So, for a classical economist, instead of using short term fiscal policy "gap-busting" to correct short term deviations from potential national income (boosting or reducing government expenditures to correct recessionary and inflationary gaps), policies should focus on brining potential national income forward, and closing the gap through increased potential economic growth! We call this SUPPLY-SIDE ECONOMICS

SO... let's say that an economy is in an inflationary state... there are a few things which policy-makers can do to fix this

1: They can do nothing. The chain and anchor system of long term economic adjustment will make wages higher, which shifts AS to the left and brings the economy back to Y*, but with a higher price level
2: The government could engage in some "gap-busting" policies (ie: they could raise taxes and decrease expenditures to kick aggregate demand back to the left, which would bring equilibrium GDP back to its potential levels)
3: The government could focus on increasing long run aggregate supply. This is also called Reaganomics: some policies in with vein include cutting personal income taxes (which increases incentives to work), cutting corporate income taxes (which increases production and investment). This shifts LRAS to the right to close the gap, and arguably, there is no negative effect on overall tax revenues, despite these cuts (because the increased long run equilibrium national income creates a larger tax base, so the government is still able to generate the same amount of revenue, despite taxing at lower rates).

CRITICISMS of SUPPLY SIDE ECONOMICS

Although these sorts of policies may increase LRAS, critics note that decreases in personal income tax also increase disposable income, which drives consumption upward. Also, decreases in corporate income tax are likely to cause corporations to increase their levels of investment. Thus, while LRAS will shift to the right, aggregate demand will also shift to the right, and the inflationary gap will persist, even if the economy's productive potential grows. This means that economies where supply side economic policies are instated will experience EVEN LARGER price inflation.

FISCAL POLICY

There are two different models we use for the economy: the short run model and the long run model. These two models are very different.

Fiscal policies which are based on the long run model is focused on increasing economic growth by increasing either labour, capital, or technology. These are factors which cause the potential national income to shift, and thus, they create long-run changes in economic potential.

The short run model, on the other hand, deals with temporary fluctuations in the economy which causes GDP to fall above or below potential: this is the economy model which is centered around the business cycle. Most policies in this vein are based around gap-busting, or eliminating recessionary and inflationary gaps.

It is not particularly difficult to determine the direction of the shift which must be kickstarted by fiscal policies: rather, it is the mixture and the magnitude which is hard to determine (for an example, if lowering taxes is likely to eliminate a recessionary gap, the question which the government must ask is how much of a tax cut should be given, how long should these cuts persist for, and which taxes should be affected by the cut).

STABILIZATION POLICY
-This is meant to damped the fluctuations caused by the business cycle
-This reduces the amplitude of the fluctuations (so recessionary and inflationary gaps are less extreme)
-This is GAPBUSTING!

While the automatic economic adjustment which occurs thanks to natural wages shifts WILL bring economies back to potential GDP, one problem is that the natural adjustment process can take a very long time, and while the economy is adjusting to reduce a recessionary gap, unemployment will be high, and the economy will remain unproductive for a long while. Government stabilization policies can fix recessionary gaps a lot more quickly by increasing government expenditures and decreasing taxation. This boosts aggregate demand, and shifts equilibrium GDP back to Y* a lot more quickly than the natural AS shift to the right would have.

Contractionary fiscal policy works in a very similar way: if there is an inflationary gap, the government increases taxation and decreases government expenditure to shift aggregate demand to the right, thus bringing equilibrium GDP back to Y* much faster than the natural AS shift to the left would have.

THE PARADOX OF THRIFT!

In a recession, the natural tendency is for individuals to increase savings: while such prudent actions may benefit individuals, on a larger aggregate level, frugality decreases consumption, and therefore, it also reduces aggregate expenditures, aggregate demand, and GDP as a whole. As a result, this psychological tendency towards thriftiness in a recession can exacerbate recessionary gaps. A historical example of this occurred in the great depression when governments actually RASIED taxes as a response to the hard economic times.

Note* this negative economic result of savings only really applies to the short run: in the short run, increased savings means decreased consumption, and therefore decreased aggregate demand. In the long run, however (as we will learn in the next chapter), an increase in savings facilitates an increase in investment, which leads to a higher aggregate demand.

AUTOMATIC FISCAL STABILIZATION: This refers to built-in tax and expenditure rates which automatically stabilize the business cycle without the government having to specifically set up any policies
-Basically, tax 'n spend systems decrease the simple multiplier, so injections and withdrawals from the economy create smaller shifts in GDP.
-Automatic stabilization can be represented by the slope of the budget function (as GDP increases, there are more withdrawals from the economy)
-Discretionary stabilization (ie: expansionary and contractionary policies) can be represented by a shift in the budget function (so governments are taxing and spending at different rates for the same national income rate)
-Taxes aren't the only automatic stabilizer: other ones include employment insurance and welfare payments (which are forms of withdrawals or expenditures)

ONE FINAL IMPORTANT THOUGHT: WHY ARE ECONOMISTS SO LEERY ABOUT FISCAL STABILIZATION POLICY???
Why not just increase expenditures and lower taxes to fight unemployment???

Wellll....

There can be policy lags- so by the time a budgetary policy gets through the political process and takes effect, it may already be obsolete, or even counter-productive (remember, stabilization policy is extremely time-sensitive)

Also, economists recognize that many households are not "fooled" by short term changes in tax structures. Many households base their spending on what they believe their long term incomes are going to be (as Milton Friedman predicted), so short term changes in taxation which temporarily boosts income may not cause changes in spending habits.

Finally, most economists believe that fiscal policy creates too broad and general a change in the economic environment to fine tune an economy for optimal performance. While stabilization policy may be useful when large, sweeping economic changes are required, many economists believe that it is unnecessary overkill for small economic imbalances which will correct themselves.

THE LONG TERM EFFECTS OF FISCAL POLICY

While increased government purchases lead to increased AE, AD, and GDP in the short run, in the long run, they may "crowd out" private-sector consumption and investment
Similarly, while decreased taxes may increase AE, AD, and GDP in the short run, the long run effect is less clear. On the one hand, some economists believe that decreased taxes may increase investment and incentive to work in the long run, thus drumming up GDP. On the other hand, some economists believe that decreased taxes may crowd out public spending on public goods (case and point, check out Alberta's decaying public infrastructure)

Friday, February 12, 2010

Supply Shocks and Other Important Things!

SUPPLY SHOCKS: These also correct themselves in the long-run, but unlike demand shocks, these do not cause any net changes in the price level.

NEGATIVE SUPPLY SHOCK
-Let's say that the cost of oil rises: this shifts AS to the left, which decreases overall economic output and increases the price level.
-There is now a recessionary gap in the economy, and this will cause unemployment to rise
-As unemployment rises, firms can get away with paying their workers less, so wages fall
-Because wages are a cost, production costs fall, and this shifts aggregate supply to the right, back to equilibrium
-Ultimately, the economy is right back where it started at: there is NO NET CHANGE

POSITIVE SUPPLY SHOCK
-Let's say that a new technology emerges which lowers the price of electricity: this shifts AS to the right, which increases overall economic output and decreases the price level
-There is now an inflationary gap in the economy, and this will cause unemployment to fall below its natural level
-As unemployment falls wages rise (overtime and worker retention)
-Because wages are a cost, production costs rise, and this shifts aggregate supply to the left, back to equilibrium
-Ultimately, the economy is right back where it started at: there is NO NET CHANGE

BUT, just because the economy is the same, this doesn't mean that wealth doesn't shift. In the event of a negative supply shock wealth tends to shift from the workers to the capital owners (so workers are paid less, and company owners make more money)

------------------------------

SHOCKS AND THE BUSINESS CYCLE

Positive supply and demand shocks cause GDP to rise above it's potential level for a period of time, and then to fall back to potential (because inflationary gaps cause decreased unemployment, higher wages, and increased factor prices)

THESE SHOCKS ARE RANDOM...

SO:

The economy's adjustment system accounts for these random shocks, and basicaly incorporates them into business cycles (short term fluctuations of the economy)

--------------------------

LONG RUN AGGREGATE SUPPLY: This is the relationship between price and GDP after changes in input prices have been taken into account. LRAS is the result of automatic adjustments which bring GDP back to its potential level. LRAS is also called classical aggregate supply, because classical economists assumed that the economy has an automatic tendency to return to Y*

LRAS, graphically, is a vertical line at Y*, because the amount of goods produced at the normal utilization rate is Y*

The only thing which this can be used to demonstrate is price changes: as long as factor prices rise by the same proportion as output prices, then Y*remains constant

----------------------------

SHIFTING Y*

Saturday, January 30, 2010

MACROECONOMIC EQUILIBRIUM: Putting it all Together

So, we have the aggregate supply curve and we have the aggregate demand curve.
AD measures levels of production which won't change over time as a function of price
AS measures levels of production which suppliers will actually produce at as a function of price.
SO... what happens when you put both of them together?

Answer: You get a real level of output which doesn't change over time (at the intersection point). Here, GDP is at an equilibrium, which means that output is equal to expenditures. Also GDP is an actual achievable level of output, which firms are willing to produce at, given the price level, to maximize profits: The actual output is in equilibrium!

The general price level is the y-axis, and we can use it to determine inflation (increases in the general price level)
GDP is the x-axis, and we can use actual GDP in relation to potential GDP to determine unemployment

This is also a stable equilibrium! If the price level is too low, then aggregate demand will overwhelm what producers are actually willing to produce. As production increases to meet the needs of the consumers, however, the accompanying rise in the price level reduces consumer demand until the two meet in the middle. Whenever the economy is not at macroeconomic equilibrium, there are pressures which ultimately bring it back to a state of equilibrium

Aggregate Demand Shocks and Macroeconomic Equilibrium:

These are a bit more tricky. If a change in autonomous expenditure shifts the family of aggregate expenditure functions, then in turn the Aggregate Demand function will shift (to the left in expenditure is lower, and to the right if it is higher). However, in macroeconomic equilibrium, an increase in aggregate demand predicts an accompanying increase in prices, while lower aggregate demand predicts an accompanying drop in prices (remember, firms will only produce more if prices increase to stabilize profit margins). This change in the price level changes aggregate expenditure, causing it to shift up or down due to a new price!

As a general rule, both price and output move in the same direction as a demand shock (increased demand = more output at higher prices. Decreased = less output at lower prices)

You may have noticed, but the simple multiplier, due to the change in price, can no longer predict the change in output caused by changes in expenditure. Instead, we use the multiplier (not simple, just multiplier) to determine output changes which result from expenditure changes. The multiplier is smaller than the simple multiplier. It represents the change in GDP divided by the change in aggregate expenditure.

The severity of a demand shock depends on the state of the economy: in other words, where an economy lies on the Aggregate Supply Curve.

When the economy has excess capacity (constant costs of production), it is called Keynesian short run aggregate supply (this is the flat part of the AS curve). Increases in AE cause Y to rise and Price to remain the same.

When the economy has increasing costs (the middle of this graph where the AS curve is about diagonally sloped), this is intermediate short run aggregate supply. Here, increases in aggregate expenditure cause increases in both price and output.

When the economy has rapidly increasing costs, this is classical short run supply (the vertical part of the AS curve). Here, increases in aggregate expenditure lead to increases in price, and no change in output.

Basically, the steeper AS is, the more a demand shock will affect price, and the less it will affect output.

We can have supply shocks too! The new intersection point is the new stable macroeconomic equilibrium.


Be careful- in some cases, both AS and AD will shift in response to a single event! (for an example, let's say the price level in China rises. This increases domestic AD (because of increased net exports). However, if domestic producers buy a lot of intermediate products from China, then their costs of production just rose, so aggregate supply shifts to the left. The net effect could be either positive or negative: it depends how invest producers are in chinese intermediate goods, and how much of the domestic economy is trade-determined.

Okay- that's all you'll need for the test. Good luck!

Aggregate Supply

In the short run, we're going to assume that factor prices remain constant (but later on, this can change, as we look at the long run)

The short run aggregate supply curve shows the amount which firms are willing to produce at any given price level.

Aggregate Supply is positively sloped!

Why?

Well, as firms increase output and input prices are constant, the law of diminishing marginal returns causes marginal output per factor to fall, and the short run average cost to rise. THUS, in order to retain expected profit margins, the only way for producers to feasibly increase production is to increase the price of goods: as such, as price rises, the actual GDP/output which firms will produce increases- there is a positive relationship here.

What about the slope? Why is it increasing?

Well... at low levels of output, firms have excess capacity, so they are capable of increasing output without making a huge investment, and the law of diminishing marginal returns hasn't really kicked in yet. Production can be increased at a relatively low cost (this corresponds to the flatter part of the curve)

At higher levels of output, however, there is no excess capacity, and great costs must be incurred to increase production.

Aggregate supply can shift (we call this an aggregate supply shock!). Basically, anything which would cause the cost of inputs (wages, intermediate goods, machinery, etc.) to rise OR anything which lowers the productivity of those factor inputs (like a rainy day on a farm) will shift the aggregate supply curve to the left (and consequently, lower input costs shifts AS to the right)

Friday, January 15, 2010

Adding Investment to the Consumption Function, and then Finding Equilibrium

Before we move on to investment, it's important to understand the difference between shifts in consumption and movement along the consumption function.

Movement along the consumption function occurs whenever the national income changes- if it increases, then we move up and to the right along the consumption function. If the national income decreases, we move left and downwards along the consumption function. The graph itself, however, doesn't move in response to changes in national income.

Changes in the ceteris paribus variables (wealth, expectations, and interest rates), however CAN shift the consumption function up and down. This constitutes a SHIFT in consumption!

When consumption increases, the graph shifts up. When consumption decreases, the graft shifts down.

WEALTH causes direct shifts: an increase in wealth causes an upward shift of consumption
EXPECTATIONS cause direct shifts: optimism causes upward consumption shifts, while pessimism causes downward consumption shifts
INTEREST RATES cause inverse shifts: as interest rates rise, consumption decreases and vice versa.

Most of these variables tend to remain stable in the short run, however, so economists suspect that changes in consumption are not the root cause of the fluctuations we witness in business cycles.


There are other theories about consumption other than the one we have just learned about!
Modigliani and Friedman both came up with similar theories that suggest that consumption is a function of someone's average lifelong income, rather than current disposable income. This accounts for consumption which continues to remain high after retirement- current disposable income is very low for retirees, but they are able to live off of some stockpiled income from their income throughout the rest of their lives.


Okay.. time to factor in INVESTMENT!

Remember, investment involves Plant and Equipment, Inventories, and Residential Construction. Of all of these subfactors of investment, inventories tend to fluctuate the most.

There at 3 BIG factors which affect investment, so you could think of all of these at the ceteris paribus variables for investment
-The Real Interest Rate
-Changes in Sales
-Business Confidence

(Technology improvements, a decline in the price of new capital goods, and higher relative output prices may also affect investment, but we don't have to worry about that right now)

Interest Rates have a reverse relation to investment: the higher the interest rates, the higher the opportunity cost of borrowing money for investment, so overall investment decreases as interest rates rise

Sales have a direct relationship with investment. As sales increase, businesses need to have a larger inventory to buffer possible stock depletion, and also sales requires greater production, which facilitates investment in more plant an equipment.

Business Confidence has a direct relationship with investment. If business are confident that their economic futures are promising, then they will invest in more plants, equipment, buildings, and inventories. If the prospects appear grim, however, and businesses are uncertain if they will make profits in the near future, they are far less likely to invest.

SOOO: Investment is related and affected by these three factors... BUUUUUUUUUTTTTTTTTTTTTT
INVESTMENT IS NOT RELATED TO NATIONAL INCOME! IT IS AUTONOMOUS

In other words, if we were to graph investment as a function of national income, it would be a constant, flat-line graph!

Investment stays the same even as national income change, as long as the ceteris paribus variables remain constant.
Changes in the ceteris paribus variables can shift investment up or down, however!

OKAY: That's all we need to know about investment. Now, we just have to put the two together: This is called aggregate expenditure, and we graph it as a function of national income, so AE = f(Y)
In a frugal economy (with only a bank added to the economic flow system), desired Aggregate Expenditure = Consumption + Investment
SO, AE = C + I = f(Y)
AE = autonomous consumption + mpc(national income) + Investment
AE = a +b(Y) + I

This is the aggregate expenditure function! The slope of the aggregate expenditure function is called the Marginal Propensity to Spend (The change in expenditure divided by the change in national income)
***Important: You do not want to consume MPSpend with MPS, as MPS is the marginal propensity to save (which is how much money is saved per dollar of income, or the slope of the savings function)

So, now we know what the aggregated expenditure function looks like. Now, the only thing left to do is to figure out where equilibrium is.

SO, where is equilibrium?
It's any point where Income stays constant over time!

Well, there are two ways of thinking about equilibrium in macroeconomics:
-The Garden Hose Theory suggests that equilibrium is when Income is equal to expenditures. If you think about this in terms of the circular flow diagram, this means that the incomes that household receive from firms are equal to the expenditures that firms receive from households. Here, the condition for equilibrium is that the national income must equal expenditures!

-The Bathtub theory suggests that equilibrium is when the amount of monetary injections into an economy are equal to the amount of monetary withdrawal from an economy. Think of it like a bathtub with the tap adding water to the tub, while the drain removes water from the tub. If the tap adds water to the tub at the same rate that the drain removes water from the tub, then the water level in the tub remains the same, so we could say that the tub is in equilibrium! Using our current frugal economic model, equilibrium is when savings (withdrawals) are equal to investment (injections).

You will find that the point where Y = AE and where J (Injections) = W (Withdrawals) is the same!


This is also a stable equilibrium! There are pressures which return both expenditure and investments to equilibrium levels in the event of disequilibrium!

Let's say that desired expenditure is lower than GDP: This means that people want to consume more than an economy is effectively producing. In response to this increase in demand, producers will increase their level of production to make more products to satisfy that demand. That increase in production causes gross domestic product to raise, and eventually align with expenditure!

On the other hand, if GDP is greater than expenditure, this means that more products are being produced by an economy than are being consumed by households. Businesses will notice the drop in sales, and respond by producing fewer products. This reduction in output causes the GDP to fall until it aligns with expenditure.

The savings function works similarly, BECAUSE IT IS DERIVED FROM THE CONSUMPTION FUNCTION!

We can then shift around all of these different graphs by changing ceteris paribus variables, and then try and predict where new equilibriums will be! Expect this sort of thing on your typical, Gateman-style examination! Practice this sort of activity in your precious spare time, and you'll be a macroeconomic whiz-kid!


I bet you're EXCITED!

Wednesday, January 13, 2010

The Importance of Consumption! The consumption function, and other wonderful things!

Quick review:
We have 5 basic macro-economic variables: Y,U,P,i, and e
Y is the bull's eye, which we try to control using fiscal and monetary policy
There are 4 stages to developing our economic model
1) Spendthrift (where there is just the firm and the household)
2) Frugal (which allows for spending and investment through banks)
3) Governed (which factors in taxation and government expenditure)
4) Open (which factors in imports and exports)

Our end-goal is to find the relationship between the general price level and the national income!

Here are some basic assumptions we have to make in building our macroeconomic model right now:
-Demand determines output
-The price level is constant (we pretend there is no inflation)
-In a basic economy, the interest and exchange rates remain constant
-We assume that potential national income is constant

Autonomous versus Induced Variables:
-Autonomous variables do not depend on national income, and thus are external to our model: this includes things like exports, which are determined by foreign economies, not domestic economies

Induced Variables DO depend on national income, and are thus found within our model: imports for an example tend to increase as Canada's national income grows, thus this an induced variable.

Today, we are going to learn about consumption, which is a very important part of national expenditure (the other parts being investment, government expenditure and net exports).

First: DESIRED versus ACTUAL EXPENDITURE:
-This is similar to microeconomics where we talked about willingness to buy (quantity demanded) at a given price. In Macro, we talk about the willingness to expend at a given income- it's a similar concept
-Actual aggregated expenditure is measured by NIEA (national income and expenditure accounts), which is denoted by an "a" subscript
-Desired expenditure is planned or intended expenditure
-It is a combination of consumption, investment, government expenditure, and net exports
-It is a function of national income (so national income effects expenditure)

THE CONSUMPTION FUNCTION: As a general rule, if people have more money, they spend more. Who'd have thunk...
-Consumption is a function of disposable national income! (Yd = current disposable income, which is national income minus taxes). However, in a spendthrift economy, we don't have to worry about taxation! =D

The ceteris paribus variable for the consumption function are
-Wealth (accumulated income: higher wealth generally leads to more consumption)
-Expectations (if prices are expected to rise in the future, this increases current consumption; if prices are expected to fall in the future, this decreases current consumption)
-Interest Rates (higher interest rates decreases consumption)

DESIRED CONSUMPTION IS A FUNCTION OF NATIONAL INCOME! John Meynard Keynes figured this out!

Here are some basic assumptions of the consumption function:
1) There is a break-even level of consumption (where consumption is exactly equal to disposable income)
2) as disposable income increases, consumption increases, but by less and less (in other words, the higher disposable income, the larger the portion of that income which will go into savings)
3) DESIRED CONSUMPTION IS A FUNCTION OF CURRENT DISPOSABLE INCOME!

*On a graph you can see this visually: consumption has risen with national income over the years in Canada.

Okay, so let's see one of these consumption functions!

-First off, this is a simplified version of the consumption function: most real ones would look more like curves, but we don't like to solve quadratics in this class
-The 45 degree line is where consumption is equal to disposable income- any point on this line is the break even point!
-As Y increases, so does C
-Here, Y = Yd (because this is a frugal economy)

-The slope of the consumption like is denoted by the variable 'b', and the actual term for it is the Marginal Propensity to Consume (MPC)
-The Y intercept is autonomous/exogenous expenditure which occurs even when there is no income: this is denoted by the variable 'a'
-Desired Consumption is 'C'
-Any point where consumption is higher than income has dissavings, or borrowed money, while any point where income is higher than consumption has savings

C = a + b(Yd)

for example: Consumption = 100 + 9/10(Disposable Income)

Basically
-Income is either spend (so it goes into consumption) or not spent (so it goes into savings)
-Savings are non-consumption
-Disposable income is then equal to consumption + savings
-Negative savings are dissavings, or loans
-Savings are Disposable income minus consumption
-At the break even point, income is equal to consumption, and savings is equal to zero

It is possible to build a savings function from the consumption function!

The savings function is derived from C = a + b(Yd)
S = Yd - C
if C is a straight linear function, then...
S = -a + (1-b)Yd
S = the vertical distance between C and the break even line (45 degrees)

SOME OTHER TERMS WHICH ARE IMPORTANT TO REMEMBER:
Average Propensity to Consume (APC): This is consumption divided by disposable income- this is the slope of the ray from the origin to the point being considered
Marginal Propensity to Consume (MPC): This is a change in consumption divided by a change in disposable income- this is the slope of the tangent to the curve being considered (so, for this very simplified, linear graph, it is equal to the slope of the consumption function)
Average Propensity to Save (APS): This is savings divided by disposable income- this is the slope of the ray from the origin to the point being considered on the savings function
Marginal Propensity to Save (MPS): This is a change in savings divided by a change in disposable income- this is the slope of the tangent to the curve being considered on the savings function (so for this linear savings curve, it's just equal to the slope of the savings function)

SOME MATHEMATICAL RELATIONSHIPS WHICH WILL MAKE PERFECT SENSE
Income = Consumption + Savings
Income/Income = Consumption/Income + Savings/Income, so 1 = APC + APS
/\Income//\Income = /\Consumption//\Income + /\Savings//\Income, so 1 = MPC + MPS
MPC is a value between 0 and 1
C = a + b(Yd) where a = the vertical intercept and b = MPC

THAT'S ALL FOR TODAY

Monday, January 11, 2010

Calculating National Income

There are three different approaches which we can use to determine the national income. We're going to review all of them in a big, boring, and utterly painful lecture.

1) GDP from Value Added Approach- a measure of the value of all goods and services produced in a fiscal year
2) GDP from Expenditures Side- a measurement of the flow of expenditure
3) GDP from Income Side- a measurement of the flow of income

THE VALUE ADDED APPROACH

Problem: Why not just add the value of each producer's individual output?
Answer: Because production occurs in stages, so in order to avoid counting inputs twice (ie: counting the steel used to build a car, and then the car as well), we must either include only final products in our math, OR only count the value added to products at each stage of production.

Definitions:
Double Counting: Adding the value added more than once to the final value of a good or service
Intermediate Good: output which is used as an input for another good (ie: steel used to build a car)
Final Good: Output NOT used again as an input- output used for final consumption in the time period being considered
Value Added: The value which is added to a product at each stage of production. Revenue minus the cost of intermediate goods from other firms (ie: if a car sells for $2000, and the parts used to make it cost $1000, the added value is $1000). Value added is equal to factor income (WRiP) for any stage of production.
Revenue: Factor Income (WRiP) + The cost of intermediate goods from other firms.

NOTE: Value added does not factor in the costs of factors of production from other firms (so it does not matter how much it costs a steel manufacturer to produce car-steel: this is not factored into the final value of the car)

SO...

GDP (A measure of national income) is the FINAL (not intermediate) MARKET VALUE (determined by the price system of supply and demand) of all GOODS AND SERVICES (goods are tangible, like watermelons. Services are intangible, like haircuts) PRODUCED (so only actual output is measured- flipped assets like stocks or resold real estate does not factor into GDP) in a GIVEN PERIOD (A fiscal year is April to April)

THE EXPENDITURE SIDE APPROACH:

GDP is also equal to the total amount of expenditure required to produce all of the outputs which GDP encompasses.

There are 4 different players in the economy, and thus there are 4 different types of expenditure

CONSUMPTION- Expenditure by the household. This is the 'using up' of a product by a final user. Expenditure can be on durable and non durable goods, as well as services

INVESTMENT- Expenditure by the firm. Investment refers to a change in Capital (Plant, Equipment, Inventory, or Residential Construct). Most of the time, investiture is on goods which are NOT intended for present or immediate consumption. Also, investment is for goods which are used to produce other goods (ie: sewing machines)

Plant and Equipment are "business fixed investment"
Equipment includes machinery and equipment
Inventories are used to buffer fluctuations in production and sales.
Inventories may be outputs or inputs, and they are valued at fair market value
Inventories can be considered investment because they are expenditure on goods not for current consumption, and because we assume that the firm has paid for these goods themselves
Divestment is decumulation, or the reduction of inventory- in other words, a decrease in the stock of fixed goods available to be sold
Residential Construction is investment because a house or building is consumption over a long period of time, and thus not for present consumption
-This only applies to newly built houses or buildings- not purchases from a builder or used homes

GROSS INVESTMENT = NET INVESTMENT + DEPRECIATION! REMEMBER THIS!
Depreciation is the wearing out of capital, and also the cost of replacement capital: it is forced investiture which is not earned by any factor of production

Captial Cost Allowance (CCA) is an income tax act approximation for depreciation

we use GROSS INVESTMENT to calculate GDP (gross investment for gross domestic product- it makes sense). Why? Because all investment, even on broken equipment, creates an income flow and therefore contributes to GDP.

GOVERNMENT EXPENDITURE: This includes all government purchases of goods and services
-These are valued at cost to the government, not at their market value (because it is difficult to assign a market value to certain services which are provided at cost by the government, such as courts)
-Government expenditure also includes government investment!

-TRANSFER PAYMENTS are expenditures not in return for a service. Some examples include expenditure on the Canada Pension Plan, Employment Insurance, and Welfare payments (basically, situations where the government 'gives away' money in some form or another)
-This shows that "expenditure" is not always a "purchase"
-we EXCLUDE transfer payments from our calculation of the government''s expenditures when accounting for GDP

NET EXPORTS:

Exports = X = Goods leaving the country and money entering the country. This adds to our GDP
Imports = M = Goods entering the country and money leaving the country. This lowers our GDP

Net Exports = X - M (it can be positive or negative)

TOTAL EXPENDITURES = GDP

SO...

GDP = Consumption + Investment + Government Expenditure + Net Exports
Y = C+I+G+NetX

Wooooooooooo!
----------------------------
THE INCOME SIDE APPROACH TO GDP
Here, we use income claims from different factors and non-factors of production to calculate the national income. To put it simply we say that the national income is equal to factor payments plus non-factor payments

FACTOR PAYMENTS (WRiP): Another word for these is Net Domestic Product at Factor Costs
"Net" means that we do not take depreciation into account
"Domestic" means that these are domestic factors (ie: we can't add Saudi oil production incomes to Canada's GDP)
"Factor Cost" means the value of output which can be accredited to factors minus the net taxes paid by the firm

DIFFERENT TYPES OF FACTOR PAYMENTS
Wages & Salaries: A return to labour- it can include gross wages, cpp, other pensions, and extra benefits (like dental)
Economic Rent: A return to land- this can include stumpage fees, or oil royalties
Interest: A return to capital- This is the rate of return of capital
Profits: A return to Entrepreneurship and Technology- This includes dividends (distributed profits) and retained earnings (undistributed profits)

NON FACTOR PAYMENTS: Indirect Business Taxes minus Subsidies plus Depreciation
Non factor payments are money which is paid to firms which are not for income claims by factors
In other words, output by firms can generate income NOT accruing to those four factors. These are non-factor payments, and there are 2 types:

1) Indirect Business Taxes less Subsidies: Tax on production collected indirectly by third parties (like excise taxes, provincial sales taxes, and government sales taxes). This is a claim by the government on production which was NOT included in the net domestic product at factor costs. We add this to income to get the MARKET VALUE of goods.
Subsidies are benefits on production contributed indirectly by third parties (like the government subsidizing BC translink)- in other words, these are goods and services whose market value is artificially lowered due to government intervention. As a result, we subtract subsidies from income to get the market value of the good.

To make this easy, let's just say we want to calculate national income using what people ACTUALLY PAY for things: people actually pay indirect business taxes, so we add those, but people don't pay for subsidized portions of things, so we subtract those! Simple enough, right? =D

WriP + (IBT - Subsidies) = Net Domestic Product (NDP)

DEPRECIATION:
-This was not included in the NET domestic product at factor costs
-This is required reinvestment for simply maintaining capital stock
-It is not earned by any factor

NDP + Depreciation = GROSS DOMESTIC PRODUCT! YAY!

SOME EQUATIONS TO REMEMBER:
GDP = Factor Payments (WRiP) + Non Factor Payments ([IBT - Sub] + Dep)
NDP = GDP - Dep
NDPFC = NDP - (IBT - Sub)
WriP = NDPFC
NDPFC + (IBT - Sub) = NDP
NDP + Dep = GDP
---------------------
OTHER THINGS TO WORRY ABOUT

Gross Domestic Product versus Gross National Product

GDP: Income produced in Canada - domestic (it could be made in Canada by non-citizens and still count)
GNP: Income received by Canadians - nationals (it could be made by Canadians working outside of the country)

Calculating Gross National Product:
-GNP = GDP minus factor income produced in Canada but received by foreigners (non-Canadians) plus factor income received by Canadians from abroad

Generally, the value of Canadian based assets owned by foreigners is much greater than the value of foreign assets owned by Canadians (we do have a relatively small population in Canada), so the GDP is much higher than the GNP


Personal Income:
Personal Income is GDP minus any part NOT received by households (Depreciation, retained earnings, etc.)m plus transfer payments received by households: PI = GDP + Net Transfer Payments

Disposable Personal Income: Personal Income minus Personal Income Tax


Real Versus Nominal

Nominal values are related to money values, and change according to prices and current values. Nominal values reflect price changes and quantity changes
Real values stay constant over time. Real values only reflect quantity changes

REAL = Nominal/Price Index

For an example, real GDP = Nominal GDP/implicit GDP deflator (an implied raise in the price index, or inflation, in other words)

HOW TO DETERMINE THE IMPLICIT GDP DEFLATOR:
1: Set base year prices
2: Calculate current output at base year prices
3: Compare using ratios

GDP DEFLATOR = Current Q X Current P/Current Q X Base-year P
GDP DEFLATOR = GDP at current prices/GDP at base year prices
GDP DEFLATOR = Nominal GDP/Real GDP


Some things are omitted from GDP, for example...
-Illegal Activities (such as drug sales), because they are difficult to measure or ascertain
-Non-market Activities (such as housework, do it yourself repairs, and volunteer work), because these are not traded as services in a market
-Unreported Activities (such as bartered services or agreements), because they are difficult to measure or ascertain
-Economic "Bads" or negative externalities (such as pollution, stress, congestion, etc.)- these should be deducted from national income, but they are not traded in markets


Definitions for output
Production: Total output (GDP): This describes the size of the economy
Per Capita GDP: GDP divided by population- this is used to measure the standard of living
Productivity: GDP divided by employment, or GDP divided by # of hours worked- this is used to measure the rate of technological change and worker efficiency

Economics, however, is not involved in measuring happiness or quality of life. We leave that to other organizations!

That's all for now....